
XAT Graphs Questions [Download PDF]
Download Graphs Questions for XAT PDF – XAT Graphs questions PDF by Cracku. Practice XAT solved Graphs Questions paper tests, and these are the practice question to have a firm grasp on the Graphs topic in the XAT exam. Top 20 very Important Graphs Questions for XAT based on asked questions in previous exam papers. The XAT question papers contain actual questions asked with answers and solutions.
Download Graphs Questions for XAT
Enroll to XAT 2023 Crash Course
Question 1: Let $0 \leq a \leq x \leq 100$ and $f(x) = \mid x – a \mid + \mid x – 100 \mid + \mid x – a – 50\mid$. Then the maximum value of f(x) becomes 100 when a is equal to
a) 25
b) 100
c) 50
d) 0
1) Answer (C)
Solution:
x>=a, so |x-a| = x-a
x<100, so |x-100| = 100-x
f(x) = (x-a) + (100-x) + |x-a-50| =100
or, |x-a-50| = a
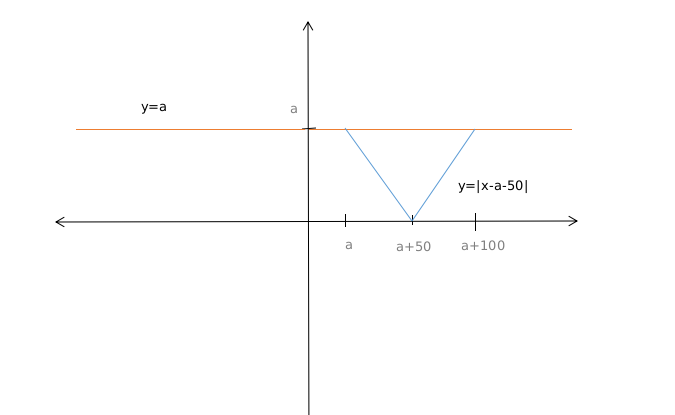
From the graph we can can see that when x=a then
|x-a-50|=a
or, a= 50
Similarly when x=a+100
|x-a-50|=a
or, a= 50
So value of a is 50 when f(x) is 100.
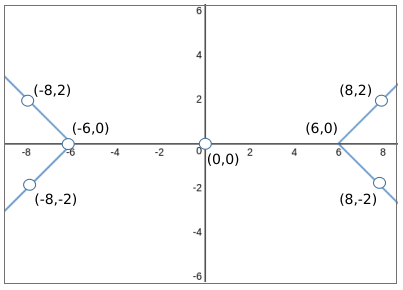
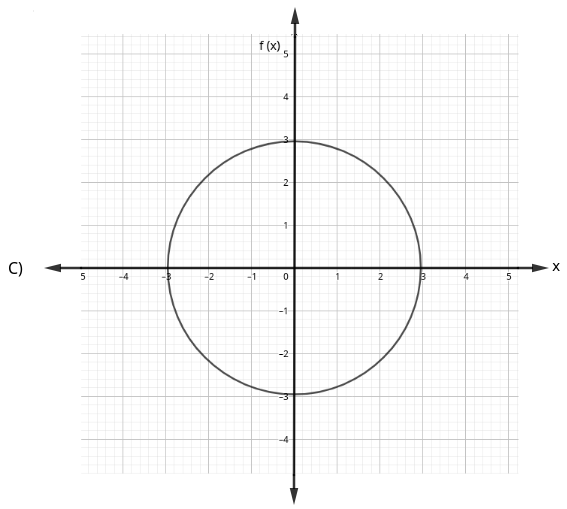
Question 2: Which of the following equations best describes the graph given below?
a) $\mid x+y\mid-\mid x-y\mid=6$
b) $\mid x-y\mid+\mid x+y\mid=10$
c) $\mid x\mid-\mid y\mid=6$
d) $\mid x+y\mid-\mid x-y\mid=0$
2) Answer (C)
Solution:
In these type of questions
we go through the options :
Now when x=6 or -6 the value of y is 0
so let us put value of y=0 in all options and check which option satisfies x=6 and -6
Putting x=6 and y=0 in option A
we get |6+0|-|6-0| = 0
But RHS =6 so this option is discarded
Now putting in option B
|6-0|+|6+0| =12
But RHS is 10
so this option is also discarded .
Now option C we get
|6|-0 =6
so we can say graph can be of |x|-|y|=6
Now satisfying option D
we get |6+0|-|6-0|=0
So we can say 6,0 and -6,0 satisfies option D as well
Now you have to eliminate between C and D
If you observe |x+y|-|x-y|=0 will pass through origin
and the graph here is not passing through origin so you can eliminate option D
Therefore the graph will be |x|-|y|=6
Question 3: Which of the following graphs represent the function of x?
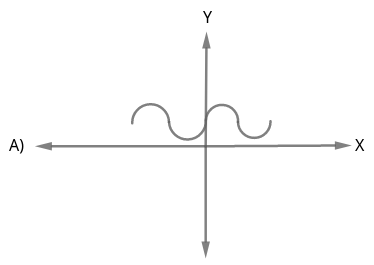
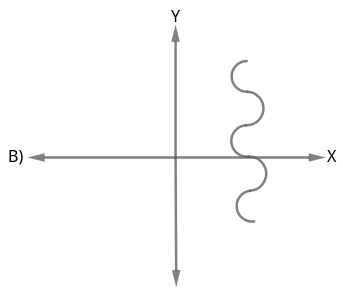
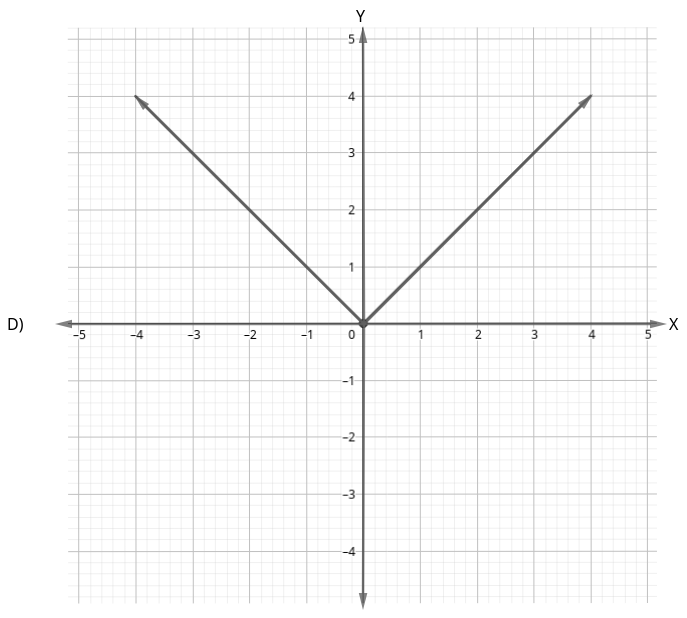
Choose the correct answer from the options given below :
a) (A), (B) and (C) only
b) (A), (B) and (D) only
c) (A) and (D) only
d) (A) and (C) only
3) Answer (C)
Solution:
Graph A and D represent the function of x, because a vertical line is drawn in (a) meets the graph at only one point i.e., for one x, in the domain there exist only one f(x) in the codomain.
Question 4: The figure below shows the graph of a function f(x). How many solutions does the equation f(f(x)) = 15 have?

a) 5
b) 6
c) 7
d) 8
e) cannot be determined from the given graph
4) Answer (C)
Solution:
It has been given that f(f(x)) = 15.
From the graph, we can see that the value of f(4) = 15 and f(12) = 15
Therefore, f(x) can be 4 or 12.

When f(x) = 4, x can take 4 values
When f(x) = 12, x can take 3 values.
Therefore, there are 4+3 = 7 solutions in total.
Therefore, option C is the right answer.
Question 5: Find the equation of the graph shown below.

a) y = 3x – 4
b) y = $2x^{2}$ – 40
c) x = $2y^{2}$ – 40
d) y = $2x^{2}$ + 3x – 19
e) x = $2y^{2}$ + 3x – 19
5) Answer (D)
Solution:
When x = -3, y = -10
This is satisfied only in option D.
Hence, option D is the correct answer.
Question 6: In the X-Y plane, the area of the region bounded by the graph of |x+y| + |x-y| = 4 is
a) 8
b) 12
c) 16
d) 20
6) Answer (C)
Solution:
If the moduli are removed, the equations formed are
x+y+x-y = 4 => x=2
x+y-x+y = 4 => y =2
-x-y+x-y = 4 => y=-2
-x-y-x+y = 4 => x=-2
The area enclosed by these equations is a square with vertices at (2,2), (-2,2), (-2,-2), (2,-2) as shown in figure.
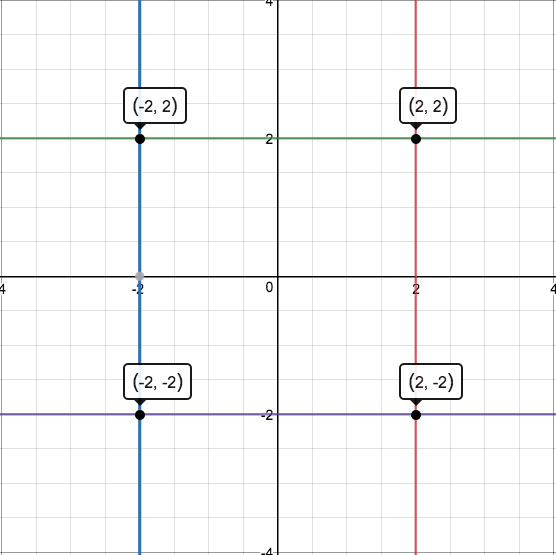
The required area = 4*4 = 16
Question 7: The graph of y – x (on the y axis) against y + x (on the x axis) is as shown below. (All graphs in this question are drawn to scale and the same scale and the same scale has been used on each axis.)
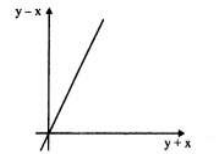
Which of the following shows the graph of y against x?
a)

b)

c)

d)

7) Answer (D)
Solution:
For a normal graph with y and x-axis, the equation of the line passing through the origin is y =mx where m is the slope of the line.
m is +ve if the angle made by the line with the x-axis is < $90^{\circ\ }$
$\therefore\ $ The equation of the line in the given graph would be y-x = k( y+ x) since the axes are y-x and y+x and the line is passing through the origin.
k > 1 because the angle is greater than 45$^{\circ\ }$
$y=\frac{k\left(x+1\right)}{1-k}$
Since k>1
Therefore y<0 for x>-1 and y>0 for x<-1
Option d correctly satisfy this condition
Question 8: Study the following graph and answer the question that follows.
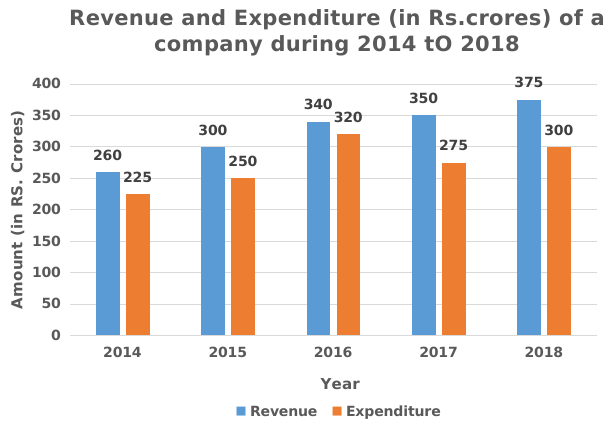
What is the total ratio of the revenue of the company in 2016 and 2018 to that of the total expenditure in 2015 and 2017 respectively?
a) 143:105
b) 130:103
c) 115:114
d) 105:143
8) Answer (A)
Solution:
Total revenue of the company in 2016 and 2018 = 340 + 375 = 715
Total expenditure of the company in 2015 and 2017 = 250 + 275 = 525
Required Ratio = 715 : 525
i.e; 143 : 105
Hence, option A is correct.
Question 9: Study the following graph and answer question that follows.

The expenditure of the company in 2016 is what percentage more then the average revenue (per year) in 2014, 2015 and 2018 (correct to the nearest integer)?
a) 3%
b) 5%
c) 6%
d) 4%
9) Answer (A)
Solution:
Expenditure of the company in 2016 = 320
Average revenue in 2014,2015 and 2018
$\therefore\frac{\left(revenue\ in\ 2014+revenue\ in\ 2015+revenue\ in\ 2018\right)}{3}$
$\therefore\frac{\left(260+300+375\right)}{3}$
= 311.67
Required percentage = $\frac{\left(320-311.67\right)}{311.67}$
$=2.67\simeq\ 3\%$
Hence, option A is correct
Question 10: The following bar graph shows the amount(in Lakh Rs.) invested by a Company in purchasing raw material over the years and the values (in Lakh Rs.) of finished goods sold by the Company over the years.
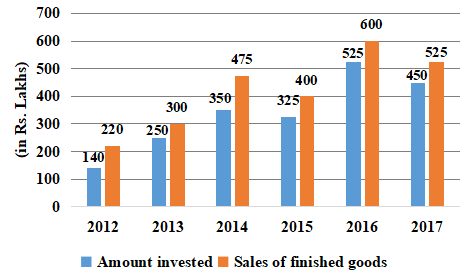
The ratio of total amount invested for purchasing raw material from 2013 to 2015 to the total sales of finished goods in 2014, 2016 and 2017 is:
a) 27 : 56
b) 56 : 27
c) 64 : 37
d) 37 : 64
10) Answer (D)
Solution:
Total amount invested for purchasing raw material from 2013 to 2015 = 250 + 350 + 325 = 925
The total sales of finished goods in 2014, 2016 and 2017 = 475 + 600 + 525 = 1600
Required ratio = 925 : 1600
= 37 : 64
Hence, the correct answer is Option D


