
Venn Diagrams Questions for RRB NTPC Set-2 PDF
Download RRB NTPC Venn Diagrams questions Set-2 PDF. Top 15 RRB NTPC questions based on asked questions in previous exam papers very important for the Railway NTPC exam.
Download Venn Diagrams Questions PDF
Take a free mock test for RRB NTPC
Download RRB NTPC Previous Papers PDF
Question 1: A feast is organised for a group of 100 people. In this feast 50 people do not like fish and 60 people like chicken. 10 people like neither fish nor chicken. How many people like both fish and chicken ?
a) 20
b) 30
c) 40
d) 10
Question 2: Which one of the following Venn diagrams best describes the words ‘days’, weeks’, calendar’ ?
a) 
b) 
c) 
d) 
Question 3: Which of the following can be described by the Venn diagram below ?

a) Dogs, Cats, Sheep
b) Chairs, Tables, Furniture
c) Planets, Galaxies, Universe
d) Physics, Chemistry, Mathematics
Question 4: In a class, 60% of children like Mathematics, 45% like Science and 25% like both Mathematics and Science. What is the percentage of children who like at least one subject?
a) 70%
b) 80%
c) 45%
d) 55%
Question 5: Choose the figure that best represents the relation ship among the classes given below ?
Keyboard, Monitor, Mouse, Scanner
a)

b)

c)

d)

RRB NTPC Previous Papers [Download PDF]
Question 6: In the given figure, the circle represents graduate, triangle represents working people, and square represents post graduate. Which region represents graduate andpost graduate but not working people?

a) G
b) D
c) F
d) C
Question 7: Which of the following diagrams represents the relationship among Sun, Moon and Star?
a) 
b) 
c) 
d) 
Question 8: Which diagram correctly represents the relationship between Human beings, Teachers, Graduates? DIAGRAM
a) 
b) 
c) 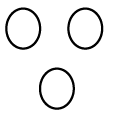
d) 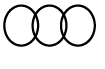
Question 9: In the following diagram, the triangle represents Mothers, circle represents Teachers and the rectangle stands for Women. Which letter (out of A, B, C and D) represents women who are mothers as also teachers ?

a) B
b) D
c) C
d) A
Question 10: Which one of the following diagrams represents the correct relationship among Poison, Bio-products and Food ?
a) 
b) 
c) 
d) 
Question 11: In the given figure the triangle represents people who visited Mysore; the circle represents people who visited Ooty, the square represents people who visited Munnar. The portion which represents people who visited both Mysore and Ooty is

a) D
b) G
c) B
d) C
Question 12: Which of the four cubes pictured below are correct view when the six squares are folded (in clockwise direction) into a cube ?
Question Figure :

a) 
b) 
c) 
d) 
Question 13: Which one of the following diagrams best depicts the relationship among pen,
pencils, stationery ?
a) 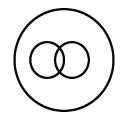
b) 
c) 
d) 
Question 14: Indicate which figure will best represent the relationship amongst the three :
Legumes Seeds, Peas, Kidney Beans
a) 
b) 
c) 
d) 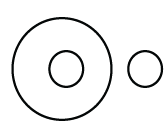
Question 15: Which one of the following diagrams best depicts the relationship among
Black eyed people, Brown haired people, Indian
a) 
b) 
c) 
d) 
Download General Science Notes PDF
Answers & Solutions:
1) Answer (A)
Number of people who like fish = 50
Number of people who like chicken = 60
Let the number of people who like both fish and chicken = x
Number of people who do not like fish = 50
Number of people who do not like chicken = 100 – 60 = 40
Number of people who do not like either fish or chicken = 10
So, number of people who do not like either fish or chicken or both = 40 + 50 – 10 = 80
Number of people who like at least one of the two dishes = 50 + 60 – x = 100 – Number of people who do not like both the dishes = 100 – 10 = 90
=> x = 20
So, 20 people like both the dishes
2) Answer (C)
The days of the week are subset of weeks and weeks are subset of the calendar. Hence, the best way to describe them using Venn Diagram is by drawing second as a subset of the first and the third as a subset of the second.
3) Answer (B)
The first two sets are non-overlapping circles embedded in a bigger circle. So, those sets should be mutually exclusive but both should be subsets of the third set. That is true in the case of chairs, tables and furniture.
4) Answer (B)
In this questions only mathematics is liked by 60%-25%=35%
Only Science is liked by 45%-25%=20%
both are liked by 25%
Percent of people who like at least one subject=35%+20%+25%
=80%
5) Answer (C)
6) Answer (C)
7) Answer (D)
Sun is a star, while moon is a planet.
=> The above relationship is depicted by :
Ans – (D)
8) Answer (A)
Both teachers and graduates are part part of human beings.
Also, some of the graduates can be teachers also and some may be not.
=> The above relation is correctly depicted by :
Ans – (A)
9) Answer (C)
In the above diagram :
Triangle represents Mothers
Circle represents Teachers
Rectangle stands for Women
So, women who are both mothers and teachers, we need to find the area which consist of triangles, circles and rectangles.
Clearly ‘C’ represents such area.
Ans – (C)
10) Answer (B)
Bio products can include food because this term is also related to agriculture. But all bio products are not food because it also includes making of fossil fuels, papers etc. We can also make different type of poison by using various bio products.
So, some bio products can be poison and some can be food.
Ans – (B)
11) Answer (D)
Triangle represents the people who visited Mysore
Circle represents people who visited Ooty
To find the portion which represents people who visited both Mysore and Ooty :
Clearly, ‘C’ is part of both triangle and circle, => ‘C’ represents people who visited both places.
Ans – (D)
12) Answer (A)
When the six squares are folded, we get :
3 lies opposite black dot
W lies opposite slanted 1
1 lies opposite white dot
Thus, Ans – (A)
13) Answer (C)
Both pens and pencils are part of stationary, and also pens are different from pencils.
Thus, the venn diagram that best describe above relationship is :
Ans – (C)
14) Answer (B)
Both peas and kidney beans are part of legumes. Also peas and kidney beans are different.
Thus, the venn diagram the best describes their relation is :
Ans – (B)
15) Answer (A)
India can consist both black eyed people and brown haired people.
Similarly, A black eyed person can have brown hair and belong to India, and also a brown haired person can have black eyes and belong to India.
Thus, the venn diagram that best depicts above relationship is :
Ans – (A)
DOWNLOAD APP FOR RRB FREE MOCKS
We hope this Venn Diagrams questions set-2 pdf for RRB NTPC exam will be highly useful for your Preparation.


