
SNAP Pie Charts Graph Questions PDF
Pie Charts Graph is an important topic in the Quant section of the SNAP Exam. You can also download this Free Pie Charts Graph Questions for SNAP PDF (with answers) by Cracku. These questions will help you to practice and solve the Pie Chart Graph questions in the SNAP exam. Utilize this PDF practice set, which is one of the best sources for practicing.
Download Pie Charts Graph Questions for SNAP
Enroll to SNAP 2022 Crash Course
Instructions
Please answer the following three questions based on the data given in the following table
and the notes below.
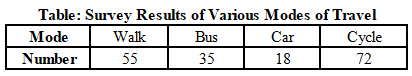
Notes:
A. 1 in 8 of the people who cycled to work were found to be over 65 years of age.
B. 1 in 3 of the cyclists stated that they travelled to work by bus on rainy days.
Question 1: If this data is represented in a pie chart, then how many degrees of arc in the pie chart represent each response in the survey results?
a) 4
b) 8
c) 6
d) 2
1) Answer (D)
Solution:
There are total 360 degrees in pie chart and there are total of 180 responses. Therefore, each response is represented by two degrees of arc in the pie chart.
Answer is option D.
Question 2: Table shows District-wise data of number of primary school teachers posted in schools of a city.
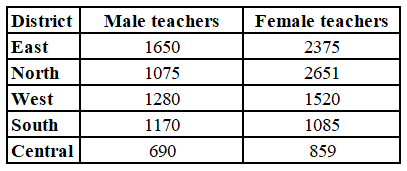
What is the difference between the total number of male teachers in the districts East, North, West taken together and the total number of female teachers in the districts East and South?
a) 735
b) 771
c) 110
d) 545
2) Answer (D)
Solution:
The total number of male teachers in the districts East, North, West taken together = 1650 + 1075 + 1280
= 4005
The total number of female teachers in the districts East and South = 2375 + 1085
= 3460
Required difference = 4005 – 3460
= 545
Hence, the correct answer is Option D
Question 3: The pie graph shows the distribution of employees working in five departments A, B, C, D and E of a company.
Total number of employees = 9000
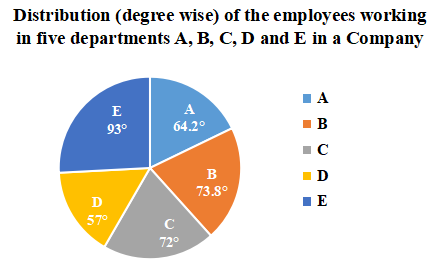
If the number of employees working in department A is x and the total number of employees working in departments C and E is y, then the value of y – 2x is:
a) 725
b) 850
c) 1000
d) 915
3) Answer (D)
Solution:
Number of employees working in department A = x = $\frac{64.2^{\circ\ }}{360^{\circ\ }}\times9000$ = 1605
x = 1605
Number of employees working in department C = $\frac{72^{\circ\ }}{360^{\circ\ }}\times9000$ = 1800
Number of employees working in department E = $\frac{93^{\circ\ }}{360^{\circ\ }}\times9000$ = 2325
The total number of employees working in departments C and E = y = 1800 + 2325 = 4125
y = 4125
y – 2x = 4125 – 2(1605) = 4125 – 3210 = 915
Hence, the correct answer is Option D
Question 4: The following Pie chart represents the percentage-wise distribution of 800 students of class XII in a school in six different sections A, B, C, D, E and F.
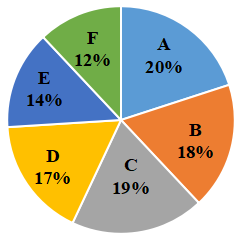
The table given below shows the number of girls of class XII in six different sections A, B, C, D, E and F.
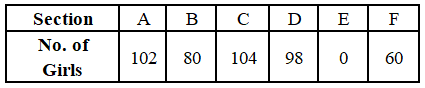
The total number of girls in sections B, C and D together is what percent more than the total number of boys in sections A, B and D together?
a) 50
b) 76.25
c) 65.75
d) 80
4) Answer (B)
Solution:
Number of students in section A = $\frac{20}{100}\times$800 = 160
Number of boys in section A = 160 – 102 = 58
Number of students in section B = $\frac{18}{100}\times$800 = 144
Number of boys in section B = 144 – 80 = 64
Number of students in section D = $\frac{17}{100}\times$800 = 136
Number of boys in section D = 136 – 98 = 38
Total number of boys in sections A, B and D together = 58 + 64 + 38 = 160
Total number of girls in sections B, C and D together = 80 + 104 + 98 = 282
Required percentage = $\frac{282-160}{160}\times$100
= $\frac{122}{160}\times$100
= 76.25%
Hence, the correct answer is Option B
Question 5: Pie-Chart shows the degree wise breakup of expenditure of a family in a month. Total income of the family is ₹144000.
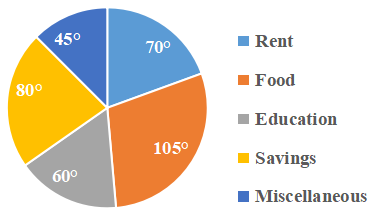
What is the expenditure (in ₹) on education?
a) 12000
b) 24000
c) 36000
d) 20000
5) Answer (B)
Solution:
The expenditure on education = $\frac{60}{360}\times$144000
= ₹24000
Hence, the correct answer is Option B
Question 6: The pie-chart shows the percentage-wise distribution of the number of students in five different schools P, Q, R, S and T. The total number of students in all five schools together is 10,500.
Study the pie-chart and answer the question.

The number of students in school R is what per cent of the total number of students in schools Q and T together?
a) 40%
b) 35%
c) 25%
d) 30%
6) Answer (D)
Solution:
Given, total number of students in all schools = 10,500
From the pie-chart,
Number of students in school R = $\frac{12}{100}\times10500=1260$
Number of students in school Q and T together = $\frac{16+24}{100}\times10500=\frac{40}{100}\times10500=4200$
$\therefore\ $Required percentage = $\frac{1260}{4200}\times100=$ 30%
Hence, the correct answer is Option D
Take SNAP mock tests here
Enrol to 10 SNAP Latest Mocks For Just Rs. 499
Question 7: The pie-chart shows the percentage-wise distribution of the number of students in five different schools P, Q, R, S and T. The total number of students in all five schools together is 10,500.
Study the pie-chart and answer the question.

The difference between the central angles corresponding to schools T and R is:
a) $42.8^\circ$
b) $44^\circ$
c) $43.2^\circ$
d) $34.5^\circ$
7) Answer (C)
Solution:
From the pie-chart,
Central angle corresponding to school T = $\frac{24}{100}\times360^{\circ}$ = $86.4^{\circ\ }$
Central angle corresponding to school R = $\frac{12}{100}\times360^{\circ}$ = $43.2^{\circ\ }$
$\therefore\ $The difference between the central angles corresponding to schools T and R = $86.4^{\circ}-43.2^{\circ}=43.2^{\circ}$
Hence, the correct answer is Option C
Question 8: The given pie-chart represents the percentage of students enrolled in five different sports. The total number of students is 2800.

What is the average number of students enrolled in Hockey and Tennis together?
a) 560
b) 580
c) 540
d) 460
8) Answer (A)
Solution:
Given, total number of students = 2800
From the pie-chart,
Number of students enrolled in Hockey = $\frac{26}{100}\times2800=728$
Number of students enrolled in Tennis = $\frac{14}{100}\times2800=392$
$\therefore\ $Average number of students enrolled in Hockey and Tennis together = $\frac{728+392}{2}=\frac{1120}{2}=560$
Hence, the correct answer is Option A
Question 9: The given pie-chart represents the percentage of students enrolled in five different sports. The total number of students is 2800.

If 24 students playing cricket are shifted to Kabaddi, then find the new ratio of the number of students in Cricket to those in Kabaddi.
a) 31 : 18
b) 30 : 17
c) 31 : 16
d) 30 : 13
9) Answer (A)
Solution:
Given, Total number of students = 2800
From the pie-chart,
Number of students enrolled for Cricket $=\frac{23}{100}\times2800=644$
Number of students enrolled for Kabaddi $=\frac{12}{100}\times2800=336$
After 24 students playing cricket are shifted to Kabaddi,
Number of students playing Cricket $=644-24=620$
Number of students playing Kabaddi $=336+24=360$
$\therefore\ $The new ratio of the number of students in Cricket to those in Kabaddi = 620 : 360 = 31 : 18
Hence, the correct answer is Option A
Question 10: The given pie chart shows the marks obtained in an examination by a student (in degrees). Observe the pie chart and answer the question that follows.

If the total marks are 720, then the difference between the total marks obtained in Physics, Maths and Physical education and the total marks in Chemistry, Biology, and English out of the total marks is:
a) 90
b) 100
c) 80
d) 110
10) Answer (C)
Solution:
Given, total marks = 720
From the pie chart,
Total marks obtained in Physics, Maths, Physical education = $\frac{70^{\circ}+80^{\circ}+50^{\circ}}{360^{\circ}}\times720$ = 400
Total marks obtained in Chemistry, Biology, English = $\frac{45^{\circ}+55^{\circ}+60^{\circ}}{360^{\circ}}\times720$ = 320
$\therefore\ $Required difference = 400 – 320 = 80
Hence, the correct answer is Option C
Question 11: The given pie chart shows the marks obtained in an examination by a student (in degrees). Observe the pie chart and answer the question that follows.

If the total marks are 720, then the marks obtained in Mathematics are:
a) 140
b) 160
c) 120
d) 80
11) Answer (B)
Solution:
Given, total marks = 720
From the pie chart,
Marks obtained in Mathematics = $\frac{80^{\circ\ }}{360^{\circ\ }}\times720$ = 160
Hence, the correct answer is Option B
Question 12: The given pie chart shows the marks obtained in an examination by a student (in degrees). Observe the pie chart and answer the question that follows.

If total marks are 720, then the marks obtained in Chemistry, Biology and Maths together is what percentage of the total marks ?
a) 50%
b) 30%
c) 60%
d) 40%
12) Answer (A)
Solution:
Given, total marks = 720
Marks obtained in Chemistry, Biology and Maths together = $\frac{45^{\circ\ }+55^{\circ\ }+80^{\circ\ }}{360^{\circ\ }}\times720$ = $\frac{180^{\circ\ }}{360^{\circ\ }}\times720$ = 360
$\therefore\ $Required percentage = $\frac{360}{720}\times100$ = 50%
Hence, the correct answer is Option A
Question 13: The given pie chart shows the marks obtained in an examination by a student (in degrees). Observe the pie chart and answer the question that follows.

If the total marks are 720, then the marks obtained in English is what percentage of the marks obtained in Maths?
a) 50%
b) 55%
c) 75%
d) 60%
13) Answer (C)
Solution:
Given total marks = 720
Marks obtained by the student in English = $\frac{60^{\circ\ }}{360^{\circ\ }}\times720$ = 120
Marks obtained by the student in Maths = $\frac{80^{\circ\ }}{360^{\circ\ }}\times720$ =160
$\therefore\ $Required percentage = $\frac{120}{160}\times100$ = 75%
Hence, the correct answer is Option C
Question 14: Study the following pie-chart and answer the given question.
The pie-chart shows the Budget Expenditure of a company in the year 2018 (percentage distribution) on different heads A, B, C, D & E.

The central angle of the sector representing expenditure on head D is:
a) $52^\circ$
b) $45^\circ$
c) $56^\circ$
d) $54^\circ$
14) Answer (D)
Solution:
From the pie-chart,
Percentage expenditure on D = 15%
The central angle of the sector representing expenditure on head D = $\frac{15}{100}\times360^{\circ\ }$ = $54^\circ$
Hence, the correct answer is Option D
Question 15: Study the following pie-chart and answer the given question.
The pie-chart shows Budget Expenditure of a company in the year 2018 (percentage distribution) on different heads A, B, C, D & E.

If ₹ 165 crore were spent in year 2018 on A, what would have been the total expenditure for that year (in ₹ crores)?
a) ₹ 400
b) ₹ 320
c) ₹ 350
d) ₹ 300
15) Answer (D)
Solution:
From the pie-chart,
Percentage expenditure on A = 55%
Let the total expenditure in 2018 = T
Expenditure on A = $\frac{55}{100}\times T$
According to the problem, expenditure on A = ₹ 165 crore
$\Rightarrow$ $\frac{55}{100}\times T=165$
$\Rightarrow$ T = ₹ 300 crore
$\therefore\ $Total expenditure in 2018 = ₹ 300 crore
Hence, the correct answer is Option D
Question 16: The given pie chart shows the percentage of students enrolled into the colleges A, B, C, D, E and F in a city, and the table shows the ratio of boys to girls in the college.

Based on this information,if the total number of students is 9800, then the number of girls in the college B is:
a) 504
b) 560
c) 280
d) 1008
16) Answer (D)
Solution:
From the data,
Number of students in college B = $\frac{16}{100}\times9800=1568$
Ratio of boys to girls in college B = 5 : 9
$\therefore\ $Number of girls in college B = $\frac{9}{5+9}\times1568=\frac{9}{14}\times1568=9\times112=1008$
Hence, the correct answer is Option D
Question 17: Study the given pie-chart and table carefully and answer the question that follows. The percentage-wise distribution of lecturers in five different subjects in a university is shown in the pie-chart. The total number of lecturers is 500.
 Find the number of male lecturers in Physics.
a) 46
b) 42
c) 44
d) 40
17) Answer (C)
Solution:
From the pie chart,
Percentage of lecturers in Physics = 22%
Number of lecturers in Physics = $\frac{22}{100}\times500$ = 110
Ratio of male to female lecturers in Physics = 2 : 3
$\therefore\ $Number of male lecturers in Physics = $\frac{2}{2+3}\times110=\frac{2}{5}\times110=44$
Hence, the correct answer is Option C


