
RRB NTPC Data Interpretation Questions PDF
Download RRB NTPC Data Interpretation Questions and Answers PDF. Top 15 RRB NTPC Data Interpretation questions based on asked questions in previous exam papers very important for the Railway NTPC exam.
Download RRB NTPC Data Interpretation Questions PDF
Take a free mock test for RRB NTPC
Download RRB NTPC Previous Papers PDF
Instructions
In a school, the percentage of students who passes the following subjects in different classes is shown in the table below. The number of students appearing from each class is 40 students. Failing in any one subject requires the candidates to get the signature from their parents. Study the table carefully and answer the questions that follow:
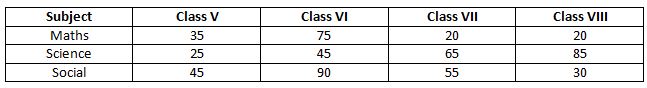
Question 1: What is the number of students from class VII, who failed in Science?
a) 35
b) 65
c) 26
d) 14
Instructions
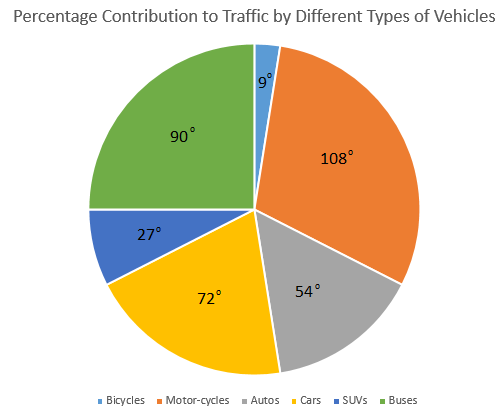
The below chart gives the distribution of traffic caused by various types of vehicles. Using the information given in the chart, answer the following questions.
Question 2: What percentage of the total traffic is due to buses and SUVs?
a) 27.5%
b) 30%
c) 32.5%
d) 35%
Question 3: If the average number of the cars that run on the road every day is 45000, how many bicycles run on the road on an average every day?
a) 4900
b) 5284
c) 5625
d) 6400
RRB NTPC Previous Papers [Download PDF]
Question 4: What is the angle at the center by Autos if buses are not included in the pie chart?
a) 60 degrees
b) 72 degrees
c) 84 degrees
d) 90 degrees
Question 5: Which of the following pairs account for more than 50% of the traffic?
a) Motorcycles and Autos
b) Cars and Buses
c) Motorcycles and Cars
d) None of these
Question 6: What percentage of the traffic is caused by SUVs?
a) 7.5%
b) 2.5%
c) 12.5%
d) 10%
Instructions
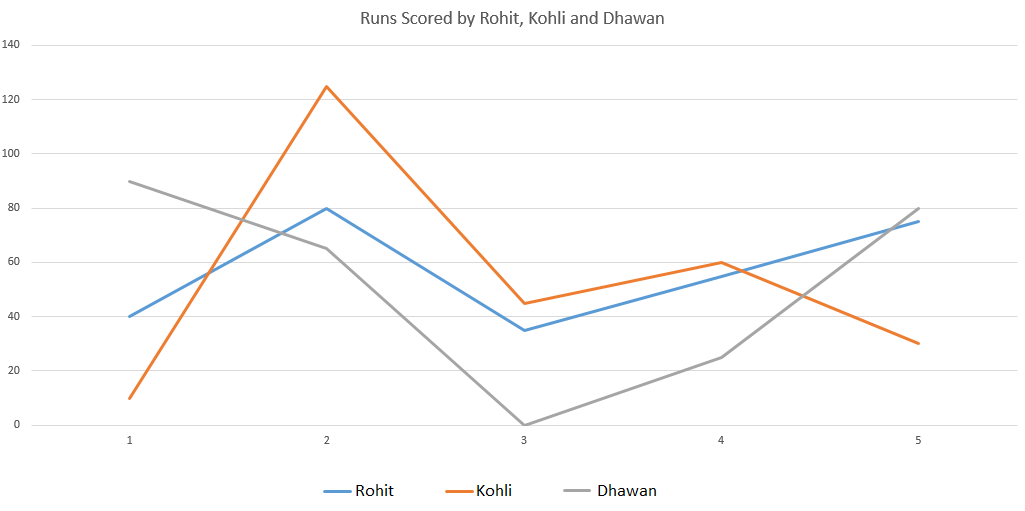
In the given line graph, the information about runs scored by Rohit, Kohli and Dhawan in five consecutive matches is given. The runs scored by each of the players in each of the five matches is a multiple of 5. Using this information, answer the below questions.
Question 7: Considering only the runs scored by these players in the five matches, the runs scored by the highest run scorer is more than the runs scored by the least run-scorer by what percentage?
a) 7.4%
b) 8.2%
c) 9.6%
d) 11.1%
Question 8: If total number of runs scored by the whole team in the third match is 320, what is the percentage contribution of runs by these three players in that match?
a) 20%
b) 25%
c) 30%
d) 35%
Download General Science Notes PDF
Instructions
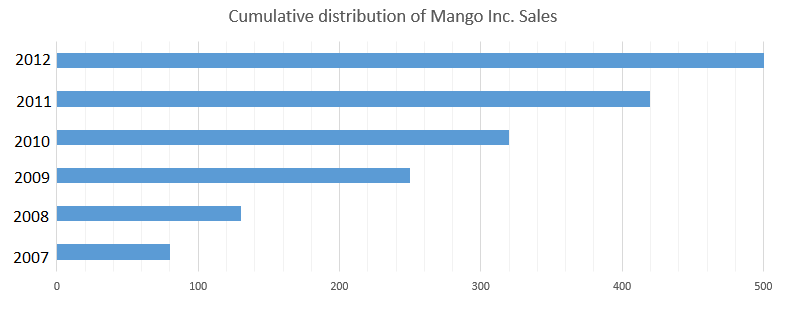
The figure gives the information regarding cumulative sales(in million) for the company Mango Inc. Based on the figure, answer the questions below.
Question 9: In which of the following years, the total sales is second highest?
a) 2009
b) 2008
c) 2012
d) 2011
Question 10: By what percentage the sales in the maximum-sales year is more than the sales in the minimum-sales year?
a) 140
b) 260
c) 380
d) 525
Question 11: Among the given six years, what is the maximum number of sales in any three-year period for the company Mango Inc?
a) 240 million
b) 250 million
c) 280 million
d) 290 million
Instructions
Table shows annual revenues of 6 companies A, B, C, D, E and F in million rupees. Study the table carefully and answer the following questions.
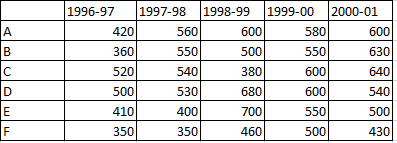
Question 12: What is the percentage decrement in the revenue earned by D for the years 1999-00 to 2000-01?
a) 14%
b) 10%
c) 8%
d) 12%
Question 13: What is the percentage decrement in the revenue earned by F for the years 1999-00 to 2000-01?
a) 18%
b) 16%
c) 15%
d) 14%
Daily Free RRB Online Tests for RRB Exams
Question 14: The total revenue of A is what percentage more than total revenue of B for five years (1996-2001)?
a) 6.5%
b) 7.5%
c) 8.5%
d) 10.5%
Question 15: What is the increment in the total revenue of company C in 2000-01 as compared to the previous year?
a) 5%
b) 6.6%
c) 7.5%
d) 8%
Download Current Affairs Questions & Answers PDF
Answers & Solutions:
1) Answer (D)
The percentage of students who passed in Science from class VII is 65%. So, the percentage that failed = 100% – 65% = 35%
So, the number of students that failed = 40* 35% = 14 students
2) Answer (C)
Angle made by SUVs = 27 degrees
Angle made by Buses = 90 degrees
Total angle made by buses and SUVs = 117 degrees.
Total angle made by whole traffic = 360 degrees
=> % of traffic due to buses and SUVs = $\frac{117}{360}*100$ = 32.5%
3) Answer (C)
Ratio of cars to bicycles = 20% : 2.5% => 8 : 1
=> Number of bicycles = $\frac{1}{8}*45000$ = 5625
=> On an average, 5625 bicycles run on road every day.
4) Answer (B)
Total angle = 360 degrees
If buses are removed from the pie chart then the remaining angle = 360 – 90 = 270 degrees.
Angle made by Autos previously = 54 degrees.
So, Auto has an angle of 54 degrees out of 270 degrees. Now, we have to find what will its angle be if we calculate it out of 360 degrees and not 270 degrees.
Angle made by autos = $\frac{54}{270}*360$ = 72 degrees
5) Answer (D)
Angle made by motor-cycles = 108 degrees => Percentage traffic by Motorcycles = $\frac{108}{360}*100$ = 30%
Angle made by autos = 54 degrees = 108/2 degrees => Percentage traffic by Autos = 30/2 = 15%
Angle made by cars = 72 degrees = 108 * (2/3) => Percentage traffic by Cars = 30 * (2/3) = 20%
Angle made by SUVs = 27 degrees = 108 * (1/4) => Percentage traffic by SUVs = 30 * (1/4) = 7.5%
Angle made by Buses = 90 degrees = 108 * (5/6) => Percentage traffic by Buses = 30 * (5/6) = 25%
Angle made by bicycles = 9 degrees = 90 * (1/10) => Percentage traffic by bicycles = 25/10 = 2.5%
Combined percentage of Motorcycles and Autos = 30 + 15 = 45%
Combined percentage of Cars and Buses = 20 + 25 = 45%
Combined percentage of motor-cycles and cars = 30 + 20 = 50%
=> None of these is the answer as none of the pairs account for more than 50%.
6) Answer (A)
The angle made at the center by the arc representing SUVs is 27 degrees.
Total traffic is equal to 360 degrees.
% traffic contributed by SUVs = $\frac{27}{360}*100$ = $\frac{300}{40}$ = 7.5%
7) Answer (C)
Total number of runs scored by Rohit = 40 + 80 + 35 + 55 + 75 = 285
Total number of runs scored by Kohli = 10 + 125 + 45 + 60 + 30 = 270
Total number of runs scored by Dhawan = 90 + 65 + 0 + 25 + 80 = 260
=> Rohit is the highest run scorer and Dhawan is the least run-scorer.
Difference = 285 – 260 = 25
% Difference = $\frac{25}{260}*100$ = 9.6%
8) Answer (B)
Runs scored by Rohit in third match = 35
Runs scored by Kohli in third match = 45
Runs scored by Dhawan in third match = 0
Total runs contributed = 35 + 45 + 0 = 80
% of runs contributed = $\frac{80}{320}*100$ = 25%
9) Answer (D)
Sales in the first year = 80 million
The given data is cumulative. So, the bar in the figure for the year 2008 also includes sales in the year 2007.
=> Sales in 2008 = 130 – 80 = 50 million
Similarly, the bar in the figure for the year 2009 also includes the sales upto the year 2008.
=> Sales in 2009 = 250 – 130 = 120 million
Using the same method, let’s calculate the sales in 2010, 2011 and in 2012.
Sales in 2010 = 320 – 250 = 70 million
Sales in 2011 = 420 – 320 = 100 million
Sales in 2012 = 500 – 420 = 80 million
Second highest sales is 100 million in 2011.
10) Answer (A)
Sales in the first year = 80 million
The given data is cumulative. So, the bar in the figure for the year 2008 also includes sales in the year 2007.
=> Sales in 2008 = 130 – 80 = 50 million
Similarly, the bar in the figure for the year 2009 also includes the sales upto the year 2008.
=> Sales in 2009 = 250 – 130 = 120 million
Using the same method, let’s calculate the sales in 2010, 2011 and in 2012.
Sales in 2010 = 320 – 250 = 70 million
Sales in 2011 = 420 – 320 = 100 million
Sales in 2012 = 500 – 420 = 80 million
Maximum sales year => 2009 => Sales in 2009 = 120 million
Minimum sales year => 2008 => Sales in 2008 = 50 million
Difference = 120 – 50 = 70 million
% difference = $\frac{70}{50}*100$ = 140%
11) Answer (D)
Sales in the first year = 80 million
The given data is cumulative. So, the bar in the figure for the year 2008 also includes sales in the year 2007.
=> Sales in 2008 = 130 – 80 = 50 million
Similarly, the bar in the figure for the year 2009 also includes the sales upto the year 2008.
=> Sales in 2009 = 250 – 130 = 120 million
Using the same method, let’s calculate the sales in 2010, 2011 and in 2012.
Sales in 2010 = 320 – 250 = 70 million
Sales in 2011 = 420 – 320 = 100 million
Sales in 2012 = 500 – 420 = 80 million
Total sales in 2007-2009 = 80 + 50 + 120 = 250 million
Total sales in 2008-2010 = 50 + 120 + 70 = 240 million
Total sales in 2009-2011 = 120 + 70 + 100 = 290 million
Total sales in 2010-2012 = 70 + 100 + 80 = 250 million
Highest sales in any 3-year period = 290 million.
12) Answer (B)
Revenue earned by D in the year 1999-00 = 600 (Million)
Revenue earned by D in the year 2000-01 = 540 (Million)
%decrement = $\frac{60}{600} \times 100 = 10\%$
13) Answer (D)
Revenue earned by F in 1999-00 = 500
Revenue earned by F in 2000-01 = 430
%difference = $\frac{70}{500} \times 100 = 14\%$
14) Answer (A)
The total revenue of A for the five years = 2760
The total revenue of B for the five years = 2590
Difference = 2760 – 2590 = 170
Hence, percentage difference = $\frac{170}{2590} \times 100$ = $6.5\%$
15) Answer (B)
Company C revenue in year 2000-01 = 640
Company C revenue in 1999-00 = 600
Difference = 40
Percentage increase = $\frac{40}{600} \times 100 = 6.6\%$
DOWNLOAD APP FOR RRB FREE MOCKS
We hope this Data Interpretation Questions for RRB NTPC Exam will be highly useful for your Preparation.


