
Data Interpretation Questions for XAT PDF
Download important Data Interpretation Questions for XAT PDF based on previously asked questions in CAT exam. Practice Data Interpretation Questions PDF for XAT exam.
Download Data Interpretation Questions for XAT PDF
Get 5 XAT mocks for Rs. 299. Enroll here
Instructions
DIRECTIONS for the following three questions: In each question, there are two statements: A and B, either of which can be true or false on the basis of the information given below.
A research agency collected the following data regarding the admission process of a reputed management school in India.
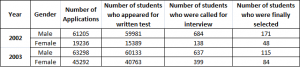
Question 1: Statement A: In 2002, the number of females selected for the course as a proportion of the number of females who bought application forms, was higher than the corresponding proportion for males.
Statement B: In 2002, among those called for interview, males had a greater success rate than females.
a) Only Statement A is true.
b) Only Statement B is true.
c) Both the Statements are true.
d) Neither of the two Statements is true.
Instructions
Directions for the following four questions: Answer the questions on the basis of the information given below.
The Dean’s office recently scanned student results into the central computer system. When their character reading software cannot read something, it leaves the space blank. The scanner output read as follows:
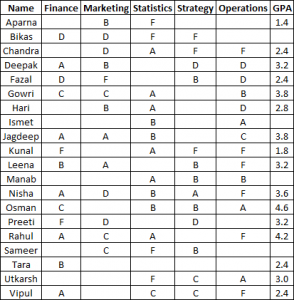
In the grading system, A, B, C, D, and F grades fetch 6, 4, 3, 2, and 0 grade points respectively. The Grade Point Average (GPA) is the arithmetic mean of the grade points obtained in the five subjects. For example Nisha’s GPA is (6 + 2 + 4 + 6 + 0) / 5 = 3.6. Some additional facts are also known about the students’ grades. These are
(i) Vipul obtained the same grade in Marketing as Aparna obtained in Finance and Strategy.
(ii) Fazal obtained the same grade in Strategy as Utkarsh did in Marketing.
(iii) Tara received the same grade in exactly three courses.
Question 2: In operations, Tara could have received the same grade as
a) Ismet
b) Hari
c) Jagdeep
d) Manab
Instructions
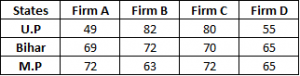
The table below presents the revenue (in million rupees) of four firms in three states. These firms, Honest Ltd., Aggressive Ltd., Truthful Ltd. and Profitable Ltd. are disguised in the table as A,B,C and D, in no particular order.
Further, it is known that:
- In the state of MP, Truthful Ltd. has the highest market share.
- Aggressive Ltd.’s aggregate revenue differs from Honest Ltd.’s by Rs. 5 million.
Question 3: What can be said regarding the following two statements?Statement 1: Profitable Ltd. has the lowest share in MP market.Statement 2: Honest Ltd.’s total revenue is more than Profitable Ltd.
a) If Statement 1 is true then Statement 2 is necessarily true.
b) If Statement 1 is true then Statement 2 is necessarily false.
c) Both Statement 1 and Statement 2 are true.
d) Neither Statement 1 nor Statement 2 is true.
Instructions
Directions for the following three questions: Answer the questions based on the pie charts given below.
Chart 1 shows the distribution of 12 million tonnes of crude oil transported through different modes over a specific period of time.
Chart 2 shows the distribution of the cost of transporting this crude oil. The total cost was Rs. 30 million.
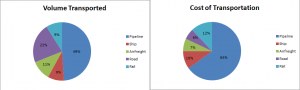
Question 4: If the costs per tonne of transport by ship, air and road are represented by P, Q and R respectively, which of the following is true?
a) R > Q > P
b) P > R > Q
c) P > Q > R
d) R > P > Q
Instructions
Answer these questions based on the data given below: The figures below present annual growth rate, expressed as the % change relative to the previous year, in four sectors of the economy of the Republic of Reposia during the 9 year period from 1990 to 1998. Assume that the index of production for each of the four sectors is set at 100 in 1989 Further, the four sectors: manufacturing, mining and quarrying, electricity, and chemicals, respectively, constituted 20%, 15%, 10%, 15 % of total industrial production 1989.

Question 5: When was the lowest level of production of the mining and quarrying sector achieved during the nine year period 1990-1998?
a) 1996
b) 1993
c) 1990
d) Cannot be determined
Instructions
The following table shows the revenue and expenses in millions of Euros (European currency) associated with REPSOL YPF company’s oil and gas producing activities in operations in different parts of the world for 1998-2000.
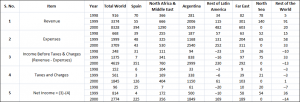
Question 6: In 2000, which among the following countries had the best profitability?
a) North Africa and Middle East
b) Spain
c) Rest of Latin America
d) Far East
Instructions
The table below gives information about four different crops, their different quality, categories and the regions where they are cultivated. Based on the information given in the table answer the questions below.

Question 7: Which of the following statements is true?
a) All medium quality Crop-2 producing regions are also high quality Crop-3 producing regions.
b) All high quality Crop-1 producing regions are also medium and low Crop-4 producing regions.
c) There are exactly four Crop-3 producing regions, which also produce Crop-4 but not Crop-2.
d) Some Crop-3 producing regions produce Crop-1, but not high quality Crop-2.
Instructions
The table below gives the achievements of Agricultural Development Programmes from 1983 – 84 to 1988 – 89. Study the following table and for each of the following questions, choose the best alternative.

Irrigation (Cumulative in Million Hectares)

High yielding varieties (Million Hectares)

Consumption of chemical fertilizers

Gross Cropped area (Million hectares)

Question 8: It is possible that a part of the minor irrigated area is brought under major and medium areas. In which year has this definitely happened?
a) 1984 – 85
b) 1985 – 86
c) 1986 – 87
d) 1987 – 88
XAT Decision making practice questions
Instructions Answer the questions based on the following information. The first table gives the percentage of students in MBA class, who sought employment in the areas of finance, marketing and software. The second table gives the average starting salaries of the students per month, (rupees in thousands) in these areas. The third table gives the number of students who passed out in each year.
Table 1:

Table 2:

Table 3:

Question 9: What is the average monthly salary offered to a management graduate in 1993?
a) Rs. 6,403
b) Rs. 6,330
c) Rs. 6,333
d) Cannot be determined
Instructions
Consider the information provided in the figure below relating to India’s foreign trade in 1997-98 and the first eight months of 1998-99.
Total trade with a region is defined as the sum of exports to and imports from that region.
Trade deficit is defined as the excess of imports over exports. Trade deficit may be negative.
A:USA. B:Germany C:Other EU. D:U.K. E:Japan F:Russia
G:Other East Europe H:OPEC I:Asia J:Other LDCs K:Others
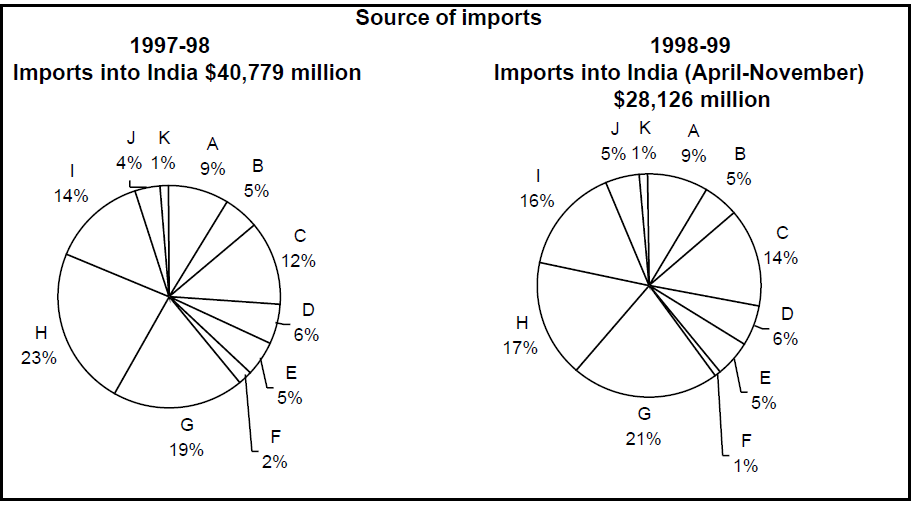
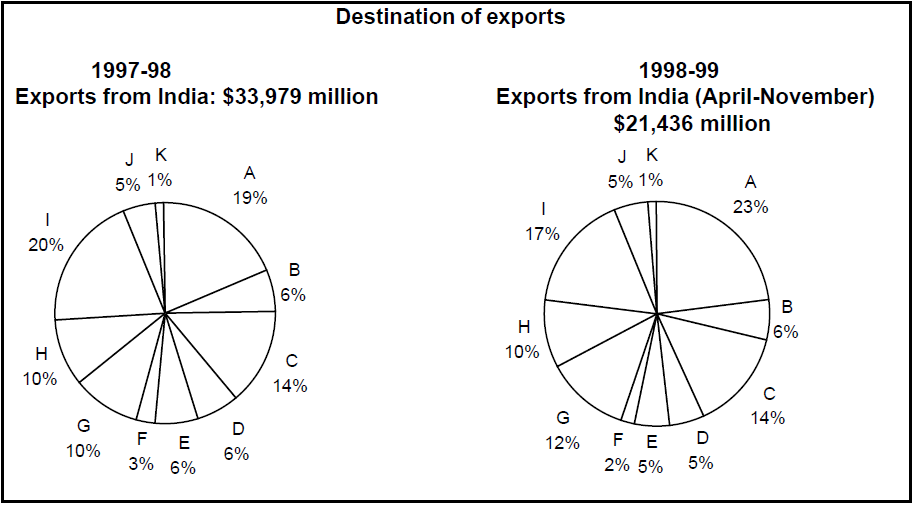
Question 10: Assume that the total exports of 1998-99 is double that of the exports done in April-November. What is the percentage growth rate in India’s total trade deficit between 1997-98 and 1998-99?
a) 43
b) 96
c) 91
d) 40
Answers & Solutions:
1) Answer (D)
In 2002, the number of females selected for the course as a proportion of the number of females who bought application forms was 48/19236 and for males was 171/61205. So rate for males was higher than that of female. Hence option A is false.
In 2002, among those called for interview, the success rate for females was 48/138 and for males 171/684. So the rate was higher for females .Both are false. Hence option D.
2) Answer (D)
Since tara received the same grade in exactly 3 subjects , only one possibility is getting B in 3 subjects and F in other 2. So in operation her grade would be either B or F.Among options only manab has B in operations . hence option D.
3) Answer (B)
We have ,

There is a difference of 5 million between Firm A and Firm D and also between Firm C and Firm B .
Now if Profitable Ltd. has the lowest share in MP market then Firm B is profitable ltd. Honest ltd. would be any firm out of A and D. So now if statement 1 is true then statement 2 is false as honest will have more revenue than profitable. hence option c.
4) Answer (C)
If the costs per tonne of transport by ship, air and road are represented by P, Q and R respectively.
P = 10/9
Q = 7/11
R = 6/22
We can see that P>Q and Q>R and P>R. Hence option C.
5) Answer (B)
Production rate in 1990 = 15.6 ; Production rate in 1991 = 15.7 ; Production rate in 1992 = 15.85 ; Production rate in 1993 = 15.46. So clearly we can see that production rate would be lowest in the year 1993. Hence option B.
Download XAT General Knowledge PDFs
Practice Online Gk tests for XAT
6) Answer (B)
Profitability = $\frac{Net_Income_After_Taxes}{Expenses}$
In 2000, Spain had the best profitability of 225/43.
Hence option B.
7) Answer (D)
High quality crop 2 is produced by R5, R8 and R12.
None of these regions produce crop 3.
Hence, option D is true.
None of the other options are true.
8) Answer (D)
There is a decrease in the area of minor irrigation land in 1987-88.
Hence, during this year land is brought into maor irrigation area.
9) Answer (D)
As we do not know the average salary for students who did not pursue Finance, Marketing or Software jobs, we cannot find the average salary of all the students in 1993.
Hence, a unique value cannot be determined.
10) Answer (B)
India’s trade deficit in the year 1997-98 is 40779-33979 = 6800
India’s trade deficit in the year 1998-99 is 2*(28126-21436) = 13380
Hence, the growth rate equals 13380/6800 -1 = 96%
We hope this Data Interpretation Questions PDF for XAT with Solutions will be helpful to you.


