
CAT Data Interpretation Practice Questions Set-2:
The second section of the CAT exam comprises Data Interpretation and Logical Reasoning, which is often deemed challenging by many aspirants. However, consistent practice with significant questions can help improve one’s performance in this section. To aid in this process, we are offering Set-2 for CAT DI questions that can be downloaded and thoroughly studied.
Download CAT Previous Papers PDFs
Take Free Mock Tests for CAT 2023
Instructions (1 – 5): Read the following information carefully and answer the questions which follow.
The following bar graph represents the production, exports and per capita consumption of wheat in Sri Lanka for five years 2011 to 2015.
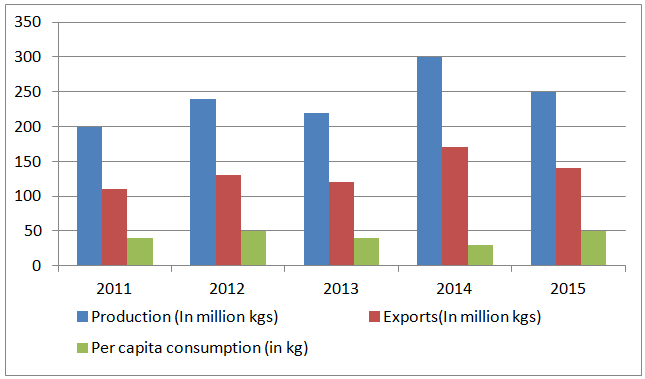
Consumption = Production – Exports
Per capita consumption = $$\frac{consumption}{population}$$
Question 1: The ratio of exports to consumption is highest for which year?
a) 2011
b) 2012
c) 2013
d) 2014
Question 2: Which year saw the highest percentage change in production?
a) 2012
b) 2013
c) 2014
d) 2015
Question 3: The population of Sri Lanka was highest in which year?
a) 2014
b) 2013
c) 2015
d) 2012
Question 4: What was the population of Sri Lanka in 2013
a) 2.5 million
b) 2.5 lacs
c) 3 million
d) 3 lacs
Question 5: The percentage change in consumption is highest for which year?
a) 2012
b) 2014
c) 2015
d) It was same for two years
Download CAT 2023 Syllabus PDF
Instructions: The Japanese car manufacturer AUXN has only two models of cars – Mercury and Venus. Both the car models comes in two varieties – fully automatic type and semi-automatic type. The line graph given depicts the trends in the number of cars sold of the two car models from 2011 – 2015. Details regarding the lines A, B, C, and D are as follows:
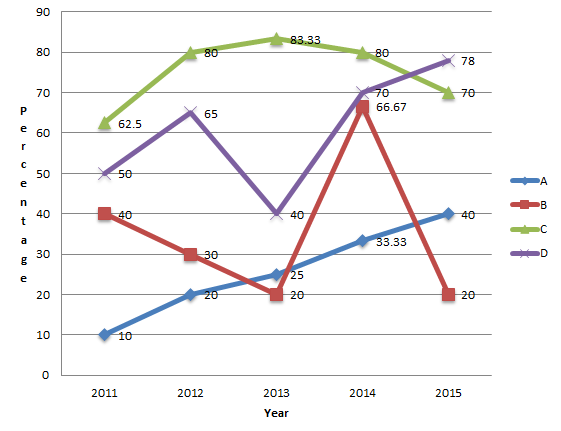
A – Percentage increase in the number of automatic Mercury cars compared to the previous year
B – Percentage increase in the number of automatic Venus cars compared to the previous year
C – Percentage of automatic Mercury cars compared to the total number of Mercury cars sold that year
D – Percentage of automatic Venus cars compared to the total number of Venus cars sold that year
Also, the percentage increase in the number of automatic Mercury and Venus cars sold in 2012 was 23.33%
Question 6: In how many years from 2011-2015 the number of Semi-Automatic Mercury cars sold was greater than the number of Semi-Automatic Venus cars?
a) 1
b) 2
c) 3
d) 4
Question 7: What is the percentage of Semi-Automatic cars sold by AUXN in 2012 compared to the total number of cars the company sold in 2012?
a) 25%
b) 27.5%
c) 55%
d) 26%
Question 8: In how many years from 2012-2015, the total cars sold by AUXN was less compared to the previous year?
a) 0
b) 1
c) 2
d) 3
Question 9: What is the percentage increase/decrease in the number of Mercury Semi-Automatic cars sold in 2014 compared to 2013?
a) 66.67%
b) 50%
c) 62.5%
d) cannot be determined
Question 10: What is the ratio of the number of Mercury Semi-Automatic cars in 2014 to the number of Venus Automatic cars in 2011?
a) 1: 3
b) 3 : 2
c) 1:1
d) cannot be determined
Dowload CAT 6 Months Study Plan PDF
Solutions for CAT Data Interpretation Practice Questions Set-2:
Solutions (1 – 5):
1) Answer (D)
In 2011
Production = 200, Exports = 110 so consumption = 90
In 2012
Production = 240, Exports = 130 so consumption = 120
In 2013
Production = 220, Exports = 120 so consumption = 100
In 2014,
Production = 300, Exports = 170 so consumption = 130
In 2015
Production = 250, Exports = 140 so consumption = 110
Clearly the required ratio is highest for 2014.
2) Answer (C)
In 2011
Production = 200
In 2012
Production = 240
In 2013
Production = 220
In 2014,
Production = 300
In 2015
Production = 250
So the percentage change in production is highest for the year 2014.
3) Answer (A)
Population = Consumption/per capita consumption
In 2011
Consumption = 90, Per capita consumption = 40
In 2012
Consumption = 120, Per capita consumption = 50
In 2013
Consumption = 100, Per capita consumption = 40
In 2014,
Consumption = 130, Per capita consumption = 30
In 2015
Consumption = 110, Per capita consumption = 50
Clearly, this ratio is highest for the year 2014.
4) Answer (A)
In 2013
Consumption = 100, Per capita consumption = 40
So required population = 100/40 = 2.5 million.
5) Answer (B)
In 2011
Production = 200, Exports = 110 so consumption = 90
In 2012
Production = 240, Exports = 130 so consumption = 110
In 2013
Production = 220, Exports = 120 so consumption = 100
In 2014,
Production = 300, Exports = 170 so consumption = 130
In 2015
Production = 250, Exports = 140 so consumption = 110
So the percentage change in consumption is highest for the year 2014.
Solutions (6 – 10):
From the given graph, the percentage increase in Mercury automatic cars in 2012 is 20% and that of Venus automatic cars is 30%. Let the number of Mercury automatic cars in 2011 be x and the number of Venus automatic cars in 2012 be y. Thus, total number of automatic cars in 2011 = x + y. Given, total number of automatic cars increases by 23.33% in 2012.
Thus, total number of automatic cars in 2012 = 1.233(x + y) = 1.2x + 1.3y
.05x = .1y
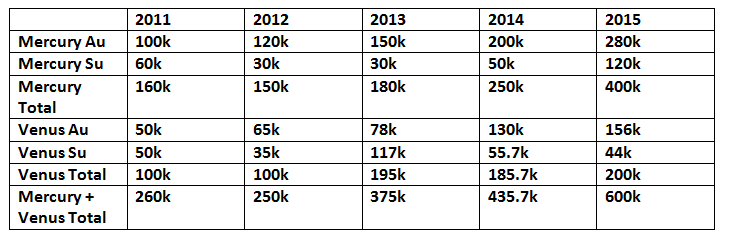
=> x = 2y. Thus, the number of automatic Mercury cars in 2011 is twice that of Venus automatic cars. Let, the number of Mercury automatic cars in 2011 be 100k and Venus automatic cars be 50k. Using information from the given chart, the following table can be formed:
6) Answer (B)
From the table, we can see that the number of Semi-Automatic cars of Mercury sold was greater than the number of Semi-Automatic cars of Venus in 2011 and 2015. Thus, B is the right choice.
7) Answer (D)
Total number of Semi-Automatic cars sold by AUXN in 2012 = 30k + 35k = 65k
Total number of cars sold by AUXN in 2012 = 150k + 100k = 250k
Thus, the required percentage = $$\frac{65}{250}\times100$$% = 26%
8) Answer (B)
The total number of cars sold was less only in 2012. Thus, B is the right choice.
9) Answer (A)
The number of Semi-Automatic Mercury cars in 2014 = 50K
The number of Semi-Automatic Mercury cars in 2013 = 30K
Thus, the required percentage increase = $$\frac{50k – 30k}{30k}\times100$$% = 66.67%
10) Answer (C)
From the table the required ratio = 50k : 50k = 1:1


[…] Data Interpretation Questions Set-2– March 19th, 2018 […]