
XAT Graphs Questions [Download PDF]
Download Graphs Questions for XAT PDF – XAT Graphs questions pdf by Cracku. Top 15 very Important Graphs Questions for XAT based on asked questions in previous exam papers.
Download Graphs Questions for XAT
Enroll to XAT 2023 Crash Course
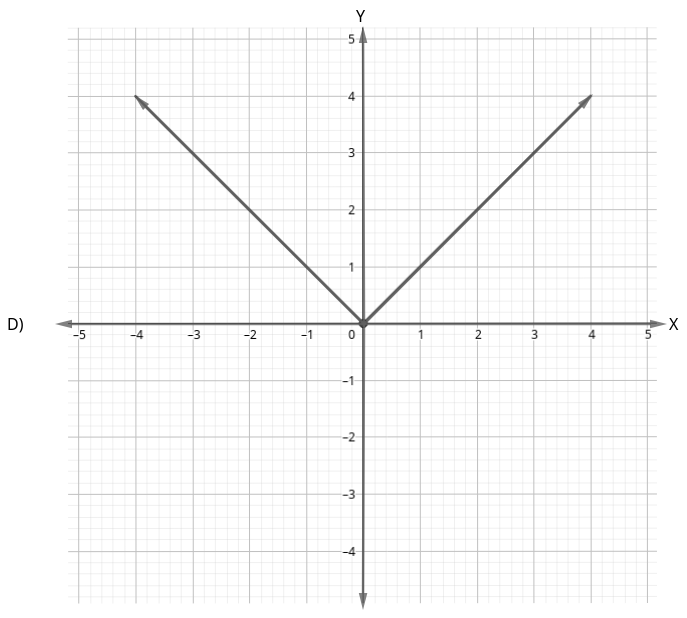
Question 1: Which of the following equations best describes the graph given below?
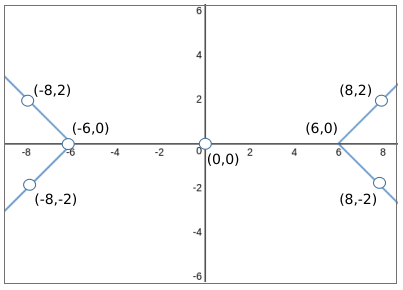
a) $\mid x+y\mid-\mid x-y\mid=6$
b) $\mid x-y\mid+\mid x+y\mid=10$
c) $\mid x\mid-\mid y\mid=6$
d) $\mid x+y\mid-\mid x-y\mid=0$
1) Answer (C)
Solution:
In these type of questions
we go through the options :
Now when x=6 or -6 the value of y is 0
so let us put value of y=0 in all options and check which option satisfies x=6 and -6
Putting x=6 and y=0 in option A
we get |6+0|-|6-0| = 0
But RHS =6 so this option is discarded
Now putting in option B
|6-0|+|6+0| =12
But RHS is 10
so this option is also discarded .
Now option C we get
|6|-0 =6
so we can say graph can be of |x|-|y|=6
Now satisfying option D
we get |6+0|-|6-0|=0
So we can say 6,0 and -6,0 satisfies option D as well
Now you have to eliminate between C and D
If you observe |x+y|-|x-y|=0 will pass through origin
and the graph here is not passing through origin so you can eliminate option D
Therefore the graph will be |x|-|y|=6
Question 2: Which of the following graphs represent the function of x?
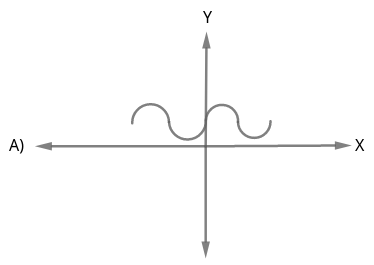
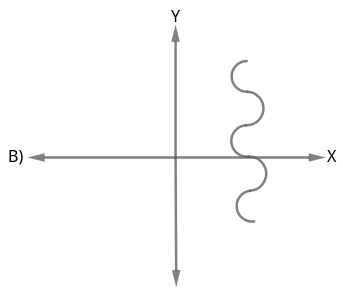
Choose the correct answer from the options given below :
a) (A), (B) and (C) only
b) (A), (B) and (D) only
c) (A) and (D) only
d) (A) and (C) only
2) Answer (C)
Solution:
Graph A and D represent the function of x, because a vertical line is drawn in (a) meets the graph at only one point i.e., for one x, in the domain there exist only one f(x) in the codomain.
Question 3: The figure below shows the graph of a function f(x). How many solutions does the equation f(f(x)) = 15 have?

a) 5
b) 6
c) 7
d) 8
e) cannot be determined from the given graph
3) Answer (C)
Solution:
It has been given that f(f(x)) = 15.
From the graph, we can see that the value of f(4) = 15 and f(12) = 15
Therefore, f(x) can be 4 or 12.

When f(x) = 4, x can take 4 values
When f(x) = 12, x can take 3 values.
Therefore, there are 4+3 = 7 solutions in total.
Therefore, option C is the right answer.
Question 4: Find the equation of the graph shown below.

a) y = 3x – 4
b) y = $2x^{2}$ – 40
c) x = $2y^{2}$ – 40
d) y = $2x^{2}$ + 3x – 19
e) x = $2y^{2}$ + 3x – 19
4) Answer (D)
Solution:
When x = -3, y = -10
This is satisfied only in option D.
Hence, option D is the correct answer.
Instructions
DIRECTIONS for the following questions: These questions are based on the situation given below: In each of the questions a pair of graphs F(x) and F1(x) is given. These are composed of straight-line segments, shown as solid lines, in the domain $x\epsilon (-2, 2)$.
choose the answer as
a. If F1(x) = – F(x)
b. if F1(x) = F(- x)
c. if F1(x) = – F(- x)
d. if none of the above is true
Question 5: 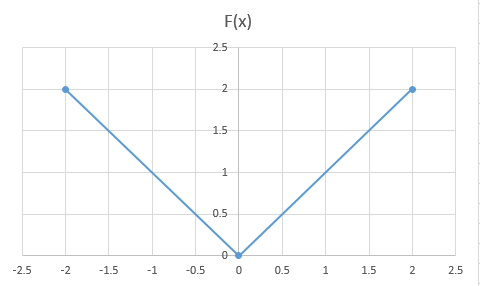
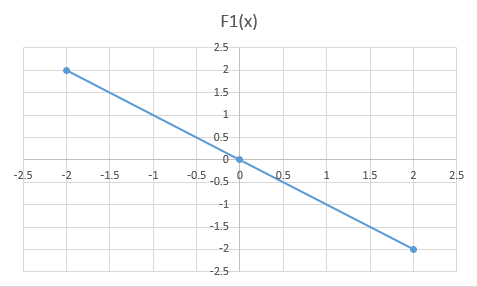
a) a
b) b
c) c
d) d
5) Answer (D)
Solution:
The correct relation between the two is: F(x) = | F1(x) |
So, all the three options a), b) and c) can be ruled out. Option d) is the correct answer.
Question 6: In the X-Y plane, the area of the region bounded by the graph of |x+y| + |x-y| = 4 is
a) 8
b) 12
c) 16
d) 20
6) Answer (C)
Solution:
If the moduli are removed, the equations formed are
x+y+x-y = 4 => x=2
x+y-x+y = 4 => y =2
-x-y+x-y = 4 => y=-2
-x-y-x+y = 4 => x=-2
The area enclosed by these equations is a square with vertices at (2,2), (-2,2), (-2,-2), (2,-2) as shown in figure.
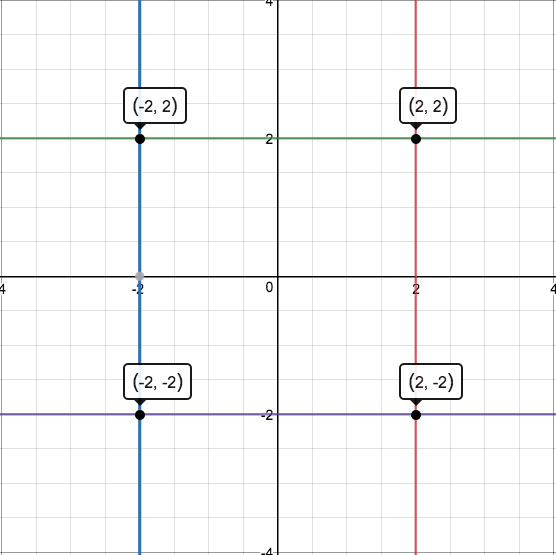
The required area = 4*4 = 16
Question 7: The graph of y – x (on the y axis) against y + x (on the x axis) is as shown below. (All graphs in this question are drawn to scale and the same scale and the same scale has been used on each axis.)
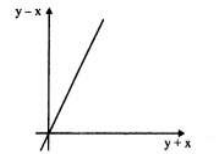
Which of the following shows the graph of y against x?
a)

b)

c)

d)

7) Answer (D)
Solution:
For a normal graph with y and x-axis, the equation of the line passing through the origin is y =mx where m is the slope of the line.
m is +ve if the angle made by the line with the x-axis is < $90^{\circ\ }$
$\therefore\ $ The equation of the line in the given graph would be y-x = k( y+ x) since the axes are y-x and y+x and the line is passing through the origin.
k > 1 because the angle is greater than 45$^{\circ\ }$
$y=\frac{k\left(x+1\right)}{1-k}$
Since k>1
Therefore y<0 for x>-1 and y>0 for x<-1
Option d correctly satisfy this condition
Instructions
<p “=””>Refer to the graph and answer the given questions.
Data related to number of books purchased for two libraries (A and B) during 6 years

Question 8: Out of the total number of books purchased by libraries A and B together in 2008, only 20% are graphic novels. What is the total number of graphic novels purchased for libraries A and B together in 2008 ?
a) 324
b) 312
c) 272
d) 336
e) 288
8) Answer (C)
Solution:

Total number of books purchased by libraries A and B together in 2008 = 520+840.
= 1360.
It is given that graphic novels are 20% of total number of books purchased by libraries A and B together in 2008.
Hence, total no. of graphic novels = $1360\times0.2$.
=$272$.
Hence, Option C is correct.
Instructions
Study the following table carefully and answer the question given below
No of marks obtained by Five Students in Five Subjects in an Examination
table.
(Total marks in all the five Subjects are 200)

Question 9: Who among them secured highest total marks in English, History and Geography ?
a) A
b) B
c) C
d) D
e) E
9) Answer (B)
Solution:
B scored 170 + 150 + 135 = 455 in English, History and Geography, which is higher than anybody else. So, the answer is (b).
Question 10: Marks obtained by C in History was approximately what percentage of marks obtained by A in Geography ?
a) 167
b) 67
c) 133
d) 33
e) 150
10) Answer (E)
Solution:
Marks obtained by C in History = 132
Marks obtained by A in Geography = 90
So, the required percentage = $\frac{132}{90}*100$ = 146.67%
Instructions
Study the following table to answer these questions:
Break up of expenditure under various plans (in Rs.Millions)

Question 11: If one of the following graphs were to represent the spending on water supply and sanitation in various plans, which of the following graphs will suit the best?


a) 1
b) 2
c) 3
d) 4
e) None of these
11) Answer (A)
Solution:
The values in each plan is increasing for water supply and sanitation.
Apart from option (A), there is a decrease in each graph which contradicts the above statement.
Thus, option A can be used to represent the spending on water supply and sanitation.
Instructions
Study the graph carefully to answer the question that follow
Per cent rise in profit of two companies over the years

Question 12: Which of the following statements is True with respect to the above graph ?
a) Company M made the highest profit in the year 2009
b) Company L made the least profit in the year 2005
c) The respective ratio of the profit earned by Company L to that by company M in the year 2006 was 6:5
d) Company L made the highest profit in the year 2008
e) All are true
12) Answer (A)
Solution:
From the graph, it is clear that for both L and M, the profit has been growing steadily over the years (positive profit growth rate). So, the highest profit for each company is record in 2009 and the lowest in 2004.
Instructions
Study the information given in each of these question and then answer the question
Question 13: What is the per cent rise in production in 2007 from 2006 ?(round off to two digits after decimal.)
graph

a) 28.18%
b) 18.18%
c) 16.28%
d) 26.18%
e) None of these
13) Answer (B)
Solution:
The increase in production = $\frac{1300-1100}{1100}\times100$
= 18.18%
InstructionsInstructions: Study the following table carefully to answer these questions.
Percentage of marks obtained by six students in six different subjects.

Question 14: What is the average marks obtained by all the students in geography?
a) 38.26
b) 37.26
c) 37.16
d) 39.16
e) None of these
14) Answer (D)
Solution:
Average marks obtained by all the students in Geography = Average percentage of all the students of 50 = 78.33% of 50 = 39.16
Instructions
Direction: The graph below gives the percentage rise in profits of two companies over the years. Study the graph carefully to answer the questions that follow.
<img “=”” alt=”” class=”img-responsive” src=”https://cracku.in/media/questionGroup/DI_4.jpg “/>
Question 15: Which of the following statements is TRUE with respect to the above graph ?
a) Company M made the highest profit in the year 2009
b) Company L made least profit in the year 2005
c) The respective ratio between the profits earned by Company L and M In the year 2006 was 6:5
d) Company L made the highest profit in the year 2008
e) All are true
15) Answer (A)
Solution:
The graphs show the percentage rise in profits. So, the profits for the two companies are increasing from 2004 to 2009. So, the highest profit by both the companies is made in 2009 and the least profit in 2004.
Consider statement A: M made the highest profit in 2009. This statement is true.
Consider statement B: L made the least profit in 2005. This statement is false.
So, the answer is option a) (Since option e) is not true anymore).


