
Venn Diagram Questions For IBPS RRB PO
Download Top-20 IBPS RRB PO Venn Diagram Questions PDF. Venn Diagram questions based on asked questions in previous year exam papers very important for the IBPS RRB PO (Officer Scale-I, II & III) exam.
Download Venn Diagram Questions For IBPS RRB PO
35 IBPS RRB PO Mocks @ Rs. 149. Enroll Now
70 IBPS RRB (PO + Clerk) Mocks @ Rs. 199
Take a free mock test for IBPS RRB PO
Download IBPS RRB PO Previous Papers PDF
Question 1: At a certain school, each of the 160 students takes atleast one of the 3 classes. The 3 classes available are English, Hindi and Spanish. 54 students study English, 86 study Hindi and 61 study Spanish. If 8 students take all 3 classes, how many take exactly 2 classes?
a) 22
b) 25
c) 31
d) 27
e) 23
Question 2: In a locality consisting of 400 families, each family reads at least one newspaper. It is known that 200 families read ‘The Hindu’. 150 families read ‘Indian Express’ and 180 families read ‘Times of India’. If it is known that exactly 40 families read all three newspapers then how many families read exactly two newspapers?
a) 80
b) 50
c) 70
d) 90
e) 60
Instructions
There are 450 students in a college. Each student has to choose one or more elective out of management, history and physics. Further following information is also known –
1) 75 students selected only management and physics.
2) 84 students selected only management and history.
3) 52 students selected only physics and history.
4) The number of students who selected only history is 137 less the number of students who selected only management.
5) In total 238 students selected management as an elective.
6) In total 240 students selected history as an elective.
Question 3: How many students selected both management and physics as elective?
a) 84
b) 107
c) 75
d) 89
e) 98
Question 4: How many students selected only management as an elective?
a) 56
b) 45
c) 58
d) 62
e) 51
Question 5: How many students selected the only history as an elective?
a) 78
b) 91
c) 81
d) 93
e) 80
Question 6: How many students select all the three electives?
a) 16
b) 29
c) 37
d) 23
e) 32
Free Mock Test for IBPS RRB PO
IBPS RRB Clerk Previous Papers
Question 7: How many students selected only physics as an elective?
a) 134
b) 79
c) 67
d) 93
e) 91
Instructions
350 people are living in a particular village. There are three drinks Tea, Coffee and Hot chocolate available in the village. Each citizen has to vote for one or more of the three drinks which he/she like. It is known that:
1) In total 120 people like Tea and 160 people like Coffee.
2) 46 people like all the three drinks.
3) 62 people like both Tea and Hot chocolate.
4) 53 people like both Hot chocolate and Coffee.
5) 89 people like both Tea and Coffee.
Question 8: How many people like only Tea?
a) 14
b) 17
c) 9
d) 29
e) 15
Question 9: How many people like only Tea and Coffee?
a) 43
b) 35
c) 47
d) 39
e) 41
Question 10: How many people like only Coffee and Hot chocolate?
a) 8
b) 11
c) 7
d) 13
e) 10
Question 11: How many people like only Coffee?
a) 56
b) 59
c) 70
d) 64
e) 52
Question 12: How many people like only Hot chocolate?
a) 124
b) 159
c) 47
d) 163
e) 91
InstructionsDirections: Answer these questions on the basis of the information given below:
(A) In a class of 80 students the girls and the boys are in the ratio of 3:5. The students can speak only Hindi or only English or both Hindi and English.
(B) The number of boys and the number of girls who can speak only Hindi is equal and each of them is 40% of the total number of girls.
(C) 10% of the girls can speak both the languages and 58% of the boys can speak only English.
Question 13: The number of girls speaking only English is what percentage of boys who speak English (approximately)?
a) 34%
b) 39%
c) 36%
d) 41%
e) 44%
Instructions
The results of annual health inspection of 100 schoolchildren is given in the following venn diagrams. It was discovered that 55% of the children were malnourished while 60% were underweight.
Question 14: How many students are vaccinated?
a) 40
b) 45
c) 50
d) 60
e) None of these
Question 15: Among students who are not vaccinated and underweight, what proportion are malnourished?
a) 1/3
b) 1/4
c) 4/9
d) 5/9
e) None of these
Quantitative Aptitude formulas PDF
520 Banking Mocks – Just Rs. 499
Question 16: What is the difference in the number of students who are adequate weight, vaccinated and adequately nourished and those who are underweight, vaccinated and adequately nourished?
a) 0
b) 5
c) 10
d) 15
e) 20
Question 17: What is the ratio of vaccinated to non-vaccinated among children who were underweight?
a) 1:3
b) 1:4
c) 1:2
d) 2:5
e) None of these
Question 18: How many children were malnourished, underweight and vaccinated?
a) 0
b) 5
c) 15
d) 10
e) 25
Instructions
Read the following paragraph carefully and answer the questions that follow:
In a software company, there are 990 employees. The ratio of part time employees to full time employees is 2:7. The employees know atleast one of the two programs: Java or C++ or both Java and C++. 10% of the part time employees know only Java. 30% of the full time employees know only C++. 20% of the total employees know only Java. The number of part time employees knowing both Java and C++ is seven times the number of part timers knowing only Java.
Question 19: In total how many part timers know Java?
a) 96
b) 116
c) 136
d) 156
e) 176
Question 20: How many full timers know only Java?
a) 96
b) 116
c) 136
d) 156
e) 176
18000 Free Solved Questions – Banking Study Material
35 IBPS RRB PO Mocks @ Rs. 149. Enroll Now
Answers & Solutions:
1) Answer (B)
Let us consider following diagram –

We know that
a+b+c+x+y+z+8 = 160
a+b+c+x+y+z = 152
Also, a+b+c+2*(x+y+z)+3*8 = 54+86+61
a+b+c+2*(x+y+z) = 177
Solving both equation we have, x+y+z = 177-152 = 25 students
So 25 students took exactly 2 subjects.
Hence, option B is the right answer.
2) Answer (B)
Let there be ‘a’ people who read exactly one newspaper, ‘b’ people who read exactly ‘2’ newspapers and ‘c’ people who read all three newspaper. So we have
a + b + c = 400
a + 2b + 3c = 150 + 180 + 200 = 530
Subtracting both the equations we get
b + 2c = 130
We have been given that c = 40
Hence, b = 130 – 80 = 50
Thus, 50 people read exactly two newspapers.
3) Answer (E)
Let ‘x’ be the number of students who took all the three electives and ‘y’ be the number of students who took only management as an elective.
We get following venn diagram –

Considering students who took management as an elective we have,
y + x + 84 + 75 = 238
x + y = 79
Considering students who took history as an elective we have,
137 – y + x + 84 + 52 = 240
y – x = 33
Adding both the equation we get,
2y = 112
y = 56
So, x = 23
So, number of students who took all the three electives = 23
Number of students who took only management = 56
Number of students who took only history = 137 – 56 = 81
So, the number of students who took only physics = 450 – 240 – 56 – 75 = 79
Thus, we get following venn diagram –

Number of students who selected both management and physics as elective = 75 + 23 = 98
Hence, option E is the correct choice.
4) Answer (A)
Let ‘x’ be the number of students who took all the three electives and ‘y’ be the number of students who took only management as an elective.
We get following venn diagram –
Considering students who took management as an elective we have,
y + x + 84 + 75 = 238
x + y = 79
Considering students who took history as an elective we have,
137 – y + x + 84 + 52 = 240
y – x = 33
Adding both the equation we get,
2y = 112
y = 56
So, x = 23
So, number of students who took all the three electives = 23
Number of students who took only management = 56
Number of students who took only history = 137 – 56 = 81
So, the number of students who took only physics = 450 – 240 – 56 – 75 = 79
Thus, we get following venn diagram –
Hence, option A is the correct choice.
5) Answer (C)
Let ‘x’ be the number of students who took all the three electives and ‘y’ be the number of students who took only management as an elective.
We get following venn diagram –
Considering students who took management as an elective we have,
y + x + 84 + 75 = 238
x + y = 79
Considering students who took history as an elective we have,
137 – y + x + 84 + 52 = 240
y – x = 33
Adding both the equation we get,
2y = 112
y = 56
So, x = 23
So, number of students who took all the three electives = 23
Number of students who took only management = 56
Number of students who took only history = 137 – 56 = 81
So, the number of students who took only physics = 450 – 240 – 56 – 75 = 79
Thus, we get following venn diagram –
Hence, option C is the correct choice.
6) Answer (D)
Let ‘x’ be the number of students who took all the three electives and ‘y’ be the number of students who took only management as an elective.
We get following venn diagram –
Considering students who took management as an elective we have,
y + x + 84 + 75 = 238
x + y = 79
Considering students who took history as an elective we have,
137 – y + x + 84 + 52 = 240
y – x = 33
Adding both the equation we get,
2y = 112
y = 56
So, x = 23
So, number of students who took all the three electives = 23
Number of students who took only management = 56
Number of students who took only history = 137 – 56 = 81
So, the number of students who took only physics = 450 – 240 – 56 – 75 = 79
Thus, we get following venn diagram –
Hence, option D is the correct option.
7) Answer (B)
Let ‘x’ be the number of students who took all the three electives and ‘y’ be the number of students who took only management as an elective.
We get following venn diagram –
Considering students who took management as an elective we have,
y + x + 84 + 75 = 238
x + y = 79
Considering students who took history as an elective we have,
137 – y + x + 84 + 52 = 240
y – x = 33
Adding both the equation we get,
2y = 112
y = 56
So, x = 23
So, number of students who took all the three electives = 23
Number of students who took only management = 56
Number of students who took only history = 137 – 56 = 81
So, the number of students who took only physics = 450 – 240 – 56 – 75 = 79
Thus, we get following venn diagram –
Hence, option B is the correct choice.
8) Answer (E)
46 people like all the three drinks. We make following venn diagram –

Since 62 people like both Tea and Hot chocolate
62 – 46 = 16 people like only Tea and Hot chocolate
Since 53 people like both Hot chocolate and Coffee
53 – 46 = 7 people like only Hot chocolate and Coffee
Since 89 people like both Tea and Coffee
89 – 46 = 43 people like only Tea and Coffee.
Thus, number of people who like only Tea = 120 – 46 – 16 – 43 = 15
Thus, number of people who like only Coffee= 160 – 43 – 46 – 7 = 64
Number of people who like only Hot chocolate = 350 – 160 – 16 – 15 = 159
We get following venn diagram –

Hence, option E is the correct choice.
9) Answer (A)
46 people like all the three drinks. We make following venn diagram –
Since 62 people like both Tea and Hot chocolate
62 – 46 = 16 people like only Tea and Hot chocolate
Since 53 people like both Hot chocolate and Coffee
53 – 46 = 7 people like only Hot chocolate and Coffee
Since 89 people like both Tea and Coffee
89 – 46 = 43 people like only Tea and Coffee.
Thus, number of people who like only Tea = 120 – 46 – 16 – 43 = 15
Thus, number of people who like only Coffee= 160 – 43 – 46 – 7 = 64
Number of people who like only Hot chocolate = 350 – 160 – 16 – 15 = 159
We get following venn diagram –
Hence, option A is the correct choice.
10) Answer (C)
46 people like all the three drinks. We make following venn diagram –
Since 62 people like both Tea and Hot chocolate
62 – 46 = 16 people like only Tea and Hot chocolate
Since 53 people like both Hot chocolate and Coffee
53 – 46 = 7 people like only Hot chocolate and Coffee
Since 89 people like both Tea and Coffee
89 – 46 = 43 people like only Tea and Coffee.
Thus, number of people who like only Tea = 120 – 46 – 16 – 43 = 15
Thus, number of people who like only Coffee= 160 – 43 – 46 – 7 = 64
Number of people who like only Hot chocolate = 350 – 160 – 16 – 15 = 159
We get following venn diagram –
Hence, option C is the correct choice.
11) Answer (D)
46 people like all the three drinks. We make following venn diagram –
Since 62 people like both Tea and Hot chocolate
62 – 46 = 16 people like only Tea and Hot chocolate
Since 53 people like both Hot chocolate and Coffee
53 – 46 = 7 people like only Hot chocolate and Coffee
Since 89 people like both Tea and Coffee
89 – 46 = 43 people like only Tea and Coffee.
Thus, number of people who like only Tea = 120 – 46 – 16 – 43 = 15
Thus, number of people who like only Coffee= 160 – 43 – 46 – 7 = 64
Number of people who like only Hot chocolate = 350 – 160 – 16 – 15 = 159
We get following venn diagram –
Hence, option D is the correct option.
12) Answer (B)
46 people like all the three drinks. We make following venn diagram –
Since 62 people like both Tea and Hot chocolate
62 – 46 = 16 people like only Tea and Hot chocolate
Since 53 people like both Hot chocolate and Coffee
53 – 46 = 7 people like only Hot chocolate and Coffee
Since 89 people like both Tea and Coffee
89 – 46 = 43 people like only Tea and Coffee.
Thus, number of people who like only Tea = 120 – 46 – 16 – 43 = 15
Thus, number of people who like only Coffee= 160 – 43 – 46 – 7 = 64
Number of people who like only Hot chocolate = 350 – 160 – 16 – 15 = 159
We get following venn diagram –
Hence, option B is the correct choice.
13) Answer (B)
Number of boys in the class = 5/8×80=50
Number of girls in the class = 80 – 50 = 30
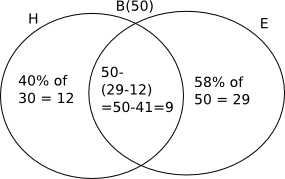
Number of boys who speak English = 29 + 9 = 38
Number of Girls who speak only English = 15
=> Required percentage = 15/38 X 100 $\approx$ 39.47 %
14) Answer (C)
We can make a table of the given values as follows:
As 60% are underweight, 60 students are underweight and 40 adequate weight. Similarly, 55 are malnourished and 45 are adequately nourished.
Let’s fill in the values given in the two venn diagrams
Hence, vaccinated, adeq wgt and malnourished = 55 – 5 – 25 – 0 = 25
Hence, vaccinated, adeq wgt and adeq nourished = 40 – 25- 5 – 0 = 10
Hence, not vaccinate, underweight and adeq nourished = 60 – 5 – 25 – 10 = 20
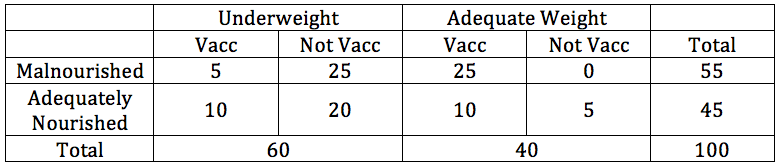
Hence, total number of students who are vaccinated = 5 + 10 + 25 + 10 = 50
15) Answer (D)
We can make a table of the given values as follows:
As 60% are underweight, 60 students are underweight and 40 adequate weight. Similarly, 55 are malnourished and 45 are adequately nourished.
Let’s fill in the values given in the two venn diagrams
Hence, vaccinated, adeq wgt and malnourished = 55 – 5 – 25 – 0 = 25
Hence, vaccinated, adeq wgt and adeq nourished = 40 – 25- 5 – 0 = 10
Hence, not vaccinate, underweight and adeq nourished = 60 – 5 – 25 – 10 = 20
Required proportion = 25 / (25+20) = 25/45 = 5/9
16) Answer (A)
We can make a table of the given values as follows:
As 60% are underweight, 60 students are underweight and 40 adequate weight. Similarly, 55 are malnourished and 45 are adequately nourished.
Let’s fill in the values given in the two venn diagrams
Hence, vaccinated, adeq wgt and malnourished = 55 – 5 – 25 – 0 = 25
Hence, vaccinated, adeq wgt and adeq nourished = 40 – 25- 5 – 0 = 10
Hence, not vaccinate, underweight and adeq nourished = 60 – 5 – 25 – 10 = 20
Hence, the required difference is 10-10 = 0.
17) Answer (A)
We can make a table of the given values as follows:
As 60% are underweight, 60 students are underweight and 40 adequate weight. Similarly, 55 are malnourished and 45 are adequately nourished.
Let’s fill in the values given in the two venn diagrams
Hence, vaccinated, adeq wgt and malnourished = 55 – 5 – 25 – 0 = 25
Hence, vaccinated, adeq wgt and adeq nourished = 40 – 25- 5 – 0 = 10
Hence, not vaccinate, underweight and adeq nourished = 60 – 5 – 25 – 10 = 20
Hence, out of 60 children who are underweight, 15 are vaccinated and 45 are not vaccinated. Hence, ratio is 1:3.
18) Answer (B)
We can make a table of the given values as follows:
As 60% are underweight, 60 students are underweight and 40 adequate weight. Similarly, 55 are malnourished and 45 are adequately nourished.
Let’s fill in the values given in the two venn diagrams
Hence, vaccinated, adeq wgt and malnourished = 55 – 5 – 25 – 0 = 25
Hence, vaccinated, adeq wgt and adeq nourished = 40 – 25- 5 – 0 = 10
Hence, not vaccinate, underweight and adeq nourished = 60 – 5 – 25 – 10 = 20
Hence, 5 children are malnourished, underweight and vaccinated.
19) Answer (E)
Number of part timers who know Java = 22 + 154 = 176
20) Answer (E)
Total employees = 990
Part time: Full time = 2 : 7
So, number of part time = $\frac{2}{2+7}$ * 990 = 220
Number of full timers = 990 – 220 = 770.
Number of part timers knowing only Java = 10% * 220 = 22
Number of full timers knowing only C++ = 30% * 770 = 231
Total number of employees who know only Java = 20% * 990 = 198
The number of part time employees knowing both the programs is 7 times of those who know only Java. So, their count = 7 * 22 = 154
So, number of part timers who know only C++ = 220 – 22 – 154 = 44
Number of full time employees who know only Java = 198 – 22 = 176
The number of full timers who know both programs = 770 – 176 – 231 = 363
So, the answer is 176


