
Important Pie Chart Questions PDF for SSC CHSL and MTS
Here you can download the Pie Chart Questions for SSC CHSL and MTS PDF with solutions by Cracku. These are the most important Pie Chart questions PDF prepared by various sources also based on previous year’s papers. Utilize this PDF for Pie Chart for SSC CHSL and MTS. You can find a list of Pie Chart in this PDF which help you to test yourself and practice. So you can click on the below link to download the PDF for reference and do more practice.
Download Pie Chart Questions for SSC CHSL and MTS
Enroll to 15 SSC CHSL 2022 Mocks At Just Rs. 149
Question 1: The pie chart given below shows the imports of 7 different items P1, P2, P3, P4, P5, P6 and P7 as a percentage of total imports of a country.

Imports of item P6 is how much percent more than the imports of item P5?
a) 75%
b) 33%
c) 80%
d) 9%
1) Answer (A)
Solution:
Let total imports be x units
Then, Imports of P5 = 12% of x = 0.12x
Imports of P6 = 21% of x = 0.21x
Then, Required percentage = $\dfrac{0.21x-0.12x}{0.12x}\times100 = \dfrac{0.9x}{0.12x}\times100 = \dfrac{3}{4}\times100 = 75$%
Question 2: The pie chart given below shows sale of different types of cars in a city for a given year. The total sale of cars in the city is 600000.

What is the sum of total number of cars sold of type T5, T6 and T3?
a) 232000
b) 228000
c) 245000
d) 252000
2) Answer (B)
Solution:
Cars sold of type T3 = 13% of 6 lakhs
Cars sold of type T5 = 17% of 6 lakhs
Cars sold of type T6 = 8% of 6 lakhs
Therefore, Total cars sold of type T3, T5 and T6 = 13% of 6 lakhs + 17% of 6 lakhs + 8% of 6 lakhs = 38% of 6 lakhs = 228000
Question 3: The pie chart given below shows sale of different types of cars in a city for a given year. The total sale of cars in the city is 600000.

What is the difference in the number of cars sold of type T5 and T1?
a) 21000
b) 24000
c) 18000
d) 27000
3) Answer (C)
Solution:
Number of cars sold of T1 = 20% of 6 lakhs
Number of cars sold of T5= 17% of 6 lakhs
Required difference = 20% of 6 lakhs – 17% of 6 lakhs = 3% of 6 lakhs = 18000
Question 4: The following pie-chart shows the percentage distribution of the expenditure incurred in publishing a book. Study the pie-chart and answer the questions based on it.

Royalty on the book is less than the paper cost by:
a) 25%
b) 30%
c) 50%
d) 40%
4) Answer (D)
Solution:
Given expenditure on royalty=15%
Expenditure on paper cost=25%
Required percentage=((25-15)/25)*100
=10*100/25
=40%
Question 5: The following pie-chart shows the percentage distribution of the expenditure incurred in publishing a book. Study the pie-chart and answer the questions based on it.

What is the central angle of the sector corresponding to the expenditure incurred on binding?
a) $72^\circ$
b) $90^\circ$
c) $48^\circ$
d) $70^\circ$
5) Answer (A)
Solution:
Percent of expenditure on binding is given as 20% in the pie diagram
Therefore 100%=360
20%=360*20/100
=72 degrees
Take a free SSC CHSL Tier-1 mock test
Download SSC CGL Tier-1 Previous Papers PDF
Question 6: The following pie-chart shows the percentage distribution of the expenditure incurred in publishing a book. Study the pie-chart and answer the questions based on it.

If for a certain quantity of books, the publisher has to pay ₹30,600 as printing cost, then what will be amount of paper cost to be paid for these books?
a) ₹28,250
b) ₹38,250
c) ₹38,000
d) ₹30,2503
6) Answer (B)
Solution:
Given in the pie diagram printing cost=20% of total expenses
paper cost=25% of total expenses
Therefore 20%=30600
25%=25*30600/20
=7650*5
=38250
Question 7: DIRECTION:The population of a city is 8000. They have various types of occupation which is given below by the pie-chart. Study the pie-chart and answer the given questions.

How much percent are in service sector from the total population?
a) 36%
b) 20%
c) 72%
d) 25%
7) Answer (B)
Solution:
In service sector 72 degrees of share i.e
360 degrees=100
72 degrees=72*100/360
=20%
Question 8: DIRECTION:The population of a city is 8000. They have various types of occupation which is given below by the pie-chart. Study the pie-chart and answer the given questions.

How much population percent is less in industry sector than in agriculture sector?
a) 10%
b) 25%
c) 15%
d) 20%
8) Answer (A)
Solution:
The share of industry sector=108 degrees
The share of agriculture sector=120 degrees
Percent greater=((120-108)/120)*100
=10%
Question 9: DIRECTION: The population of a city is 8000. They have various types of occupation which is given below by the pie-chart. Study the pie-chart and answer the given questions.

The ratio of people working in service to industry sectors respectively:
a) 2:3
b) 3:5
c) 3:4
d) 5:3
9) Answer (A)
Solution:
Total share of service sector=72 degrees
Total share of industry sector=108 degrees
Ratio=2:3
Question 10: Study the chart and answer the question based, on the pie chart.
The pie chart given below shows expenditures incurred by a family on various items and savings in a month. Savings of the family is ₹ 8,000 in a month.

What is the total expenditure of the family for the month?
a) ₹45,000
b) ₹48,000
c) ₹50,000
d) ₹40,000
10) Answer (D)
Solution:
Given 60 degrees=Rs 8000
360 degrees=Rs 48000
Total expenditure=Rs 48000
Question 11: Study the chart and answer the question based, on the pie chart.
The pie chart given below shows expenditures incurred by a family on various items and savings in a month. Savings of the family is ₹ 8,000 in a month.

How much more amount is spent on food than on housing?
a) ₹2,000
b) ₹3,000
c) ₹1,000
d) ₹2,500
11) Answer (A)
Solution:
let x be total income
Given (60/360)*x=8000
x=48000
difference between food and housing is 120-105=15 degrees
60 degrees=8000
15 degrees=2000
Question 12: Study the chart and answer the question based, on the pie chart.
The pie chart given below shows expenditures incurred by a family on various items and savings in a month. Savings of the family is ₹ 8,000 in a month.

The ratio of the expenditure on food to the savings is:
a) 2:1
b) 3:4
c) 3:2
d) 4:3
12) Answer (A)
Solution:
The angle subtended by food at the center is 120 degrees and by savings is 60 degrees
Therefore required ratio=120/60
=2:1
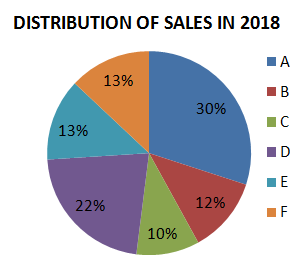
Question 13: The pie charts show the market share of the companies in the detergent market in 2017 and 2018. The total size of the market has decreased from ₹ 300 crores to ₹ 200 crores. What is the decrease in the sales of Company F?
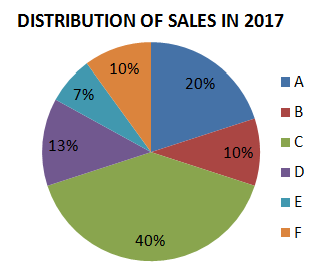
a) $14\frac{1}{3}$%
b) $12\frac{1}{3}$%
c) $33\frac{1}{3}$%
d) $13\frac{1}{3}$%
13) Answer (D)
Solution:
Sales of Company F in 2017 = 10% of Rs.300 crore = Rs.30 crore
Sales of Company F in 2018 = 13% of Rs.200 crore = Rs.26 crore
Decrease in sales = $\dfrac{30-26}{30}\times100 = \dfrac{40}{3}$% $= 13\dfrac{1}{3}$%
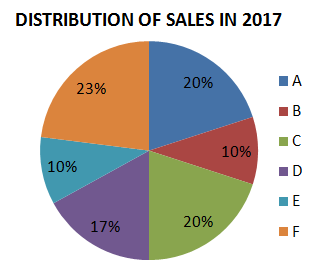
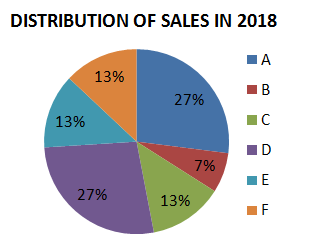
Question 14: The pie charts show the market share of companies in the rice market in 2017 and 2018. The value of sales of Company A in 2017 was ₹40 lakhs. If its sales grew by 25% in 2018, what was approximate value of sales of company B in 2018?
a) ₹12.56 lakhs
b) ₹13.96 lakhs
c) ₹12.96 lakhs
d) ₹13.56 lakhs
14) Answer (C)
Solution:
Value of sales of Company A in 2017 = Rs.40 lakhs
Value of sales of Company A in 2018 = 125% of Rs.40 lakhs = Rs.50 lakhs which is 27% of sales of all companies
27% –> Rs.50 lakhs
7% –> $\dfrac{7 \times 50}{27} = 12.96$ lakhs
Question 15: The pie chart given below shows the time taken in 7 different procedures J1, J2, J3, J4, J5, J6 and J7 in making a car as a percentage of total time taken. The total time taken in making one car is 1200 hours.

What is the difference between the time taken in processes J1 and J4?
a) 96 hours
b) 72 hours
c) 60 hours
d) 84 hours
15) Answer (B)
Solution:
Percentage of time required for J1 = 14%
Percentage of time required for J4 = 8%
Required difference = 14-8 = 6% of 1200 = 72 hours
Question 16: The pie chart given below shows the time taken in 7 different procedures J1, J2, J3, J4, J5, J6 and J7 in making a car as a percentage of total time taken. The total time taken in making one car is 1200 hours.

What will be the total taken in procedures J2 and J5?
a) 396 hours
b) 240 hours
c) 312 hours
d) 360 hours
16) Answer (D)
Solution:
Percentage of time taken in J2 = 18%
Percentage of time taken in J5 = 12%
Total time taken = 12+18 = 30% of 1200 = 360 hours
Instructions
The following table indicates the number of students studying in three disciplines in five colleges:

Question 17: If a pie-chart is drawn representing the number of students in all five colleges, what is the central angle (correct to the nearest whole number) of the sector representing the students of college B?
a) $86^\circ$
b) $82^\circ$
c) $80^\circ$
d) $84^\circ$
17) Answer (A)
Solution:
From the above table,
The number of students are available in college A$ = 950$
The number of students are available in college B $= 1200$
The number of students are available in college C $= 850$
The number of students are available in college D $= 975$
The number of students are available in college E $= 1025$
Hence, total number of students are available in the class $= 5000$
so percentage of area occupy by college B $\dfrac{1200\times 100}{5000}=24\%$
which occupy 24% of the area in the pie graph.
 Hence angle $=\dfrac{24\times360}{100}=86.6^\circ$
So, it will be approximately $86^\circ$
Question 18: The Pie chart given below presents the percentages of the number of motor cycles of different colours out of the total number of motor cycles, parked in an area. The central angles shown in the Pie chart are not as per any chosen scale.

What is the central angle (nearest to one degree) corresponding to the motorcycle of black colour?
a) 44
b) 45
c) 46
d) 47
18) Answer (D)
Solution:
As we know that the entire circle has 360$\ ^{\circ\ }$.
So 100% = 360$\ ^{\circ\ }$
1% = 3.6$\ ^{\circ\ }$
In chart, motor cycle of black colour has 13%.
So 13% = $\left(3.6\ \times\ 13\right)^{\circ\ }$
= 46.8$\ ^{\circ\ }$
= 47$\ ^{\circ\ }$ (approx.)
So option (d) will be the correct answer as per the approx. value.
Question 19: The Pie chart given below presents the percentages of the number of motor cycles of different colours out of the total number of motor cycles, parked in an area. The central angles shown in the Pie chart are not as per any chosen scale.
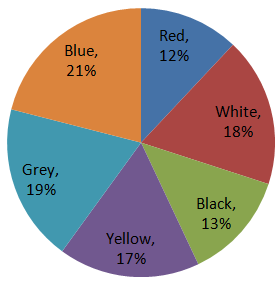
If the total number of motorcycles parked is 2300, then what is the number of red colour motor cycles out of them?
a) 284
b) 288
c) 280
d) 276
19) Answer (D)
Solution:
If the total number of motorcycles parked is 2300.
100% = 2300
1% = 23
number of red colour motor cycles out of them = 12% = $12\times\ 23$
= 276
Question 20: The Pie chart given below presents the percentages of the number of motor cycles of different colours out of the total number of motor cycles, parked in an area. The central angles shown in the Pie chart are not as per any chosen scale.

If the total number of motor cycles parked is 2300, the number having white colour is how much less than those having the blue colour?
a) 66
b) 72
c) 63
d) 69
20) Answer (D)
Solution:
If the total number of motorcycles parked is 2300.
100% = 2300
1% = 23
white colour motorcycles parked = 18% = $18\times\ 23$ = 414
blue colour motorcycles parked = 21% = $21\times\ 23$ = 483
Difference = 483-414 = 69
the number having white colour is 69 less than those having the blue colour.


