
SNAP Data Interpretation
Data Interpretation is an important topic in the Quant section of the SNAP Exam. You can also download this Free Data Interpretation Questions for SNAP PDF (with answers) by Cracku. These questions will help you to practice and solve the Data Interpretation questions in the SNAP exam. Utilize this PDF practice set, which is one of the best sources for practising.
Download SNAP Data Interpretation
Enroll to SNAP 2022 Crash Course
Instructions
The table below shows the data on Government expenditure on the insurance scheme, total expenditure and State’s own expenditure on health and family welfare. Read the table carefully and answer the following three questions.
Table: Government Expenditure Across Various Budget Heads
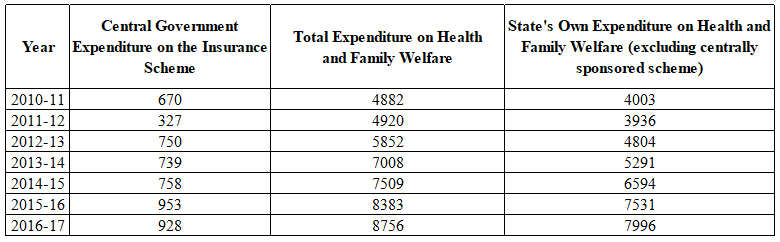
Question 1: In which year, the Central Government expenditure on the insurance scheme as a percentage of State’s own expenditure was three percentage more than the Central Government expenditure on the insurance scheme as a percentage of total expenditure on health and family welfare?
a) 2010-11
b) 2012-13
c) 2011-12
d) 2013-14
1) Answer (A)
Solution:
As a percentage of State’s own expenditure
2010-2011 – $\frac{67000}{4882}=13.72\%$
2011-2012 – $\frac{32700}{4920}=6.64\%$
2012-2013 – $\frac{75000}{5852}=12.82\%$
2013-2014 – $\frac{73900}{7008}=10.54\%$
2014-2015 – $\frac{75800}{7509}=10\%$
2015-2016 – $\frac{95300}{8383}=11.37\%$
2016-2017 – $\frac{92800}{8756}=10.6\%$
As a percentage of total expenditure on health and family welfare
2010-2011 – $\frac{67000}{4882}=13.72\%$
2011-2012 – $\frac{32700}{4920}=6.64\%$
2012-2013 – $\frac{75000}{5852}=12.82\%$
2013-2014 – $\frac{73900}{7008}=10.54\%$
2014-2015 – $\frac{75800}{7509}=10\%$
2015-2016 – $\frac{95300}{8383}=11.37\%$
2016-2017 – $\frac{92800}{8756}=10.6\%$
3% is more in 2010-2011
Answer is option A.
Question 2: In which year, the Central Government expenditure on the insurance scheme as a percentage of the total expenditure on health and family welfare was highest?
a) 2013-14
b) 2010-11
c) 2016-17
d) 2012-13
2) Answer (B)
Solution:
2010-2011 – $\frac{67000}{4882}=13.72\%$
2011-2012 – $\frac{32700}{4920}=6.64\%$
2012-2013 – $\frac{75000}{5852}=12.82\%$
2013-2014 – $\frac{73900}{7008}=10.54\%$
2014-2015 – $\frac{75800}{7509}=10\%$
2015-2016 – $\frac{95300}{8383}=11.37\%$
2016-2017 – $\frac{92800}{8756}=10.6\%$
Answer is option B.
Question 3: In which two years, the Central Government expenditure on insurance scheme as a percentage of State’s own expenditure on health and family welfare was most similar?
a) 2015-16 and 2016-17
b) 2012-13 and 2013-14
c) 2014-15 and 2016-17
d) 2010-11 and 2012-13
3) Answer (C)
Solution:
2010-2011 – $\frac{67000}{4003}=16.73\%$
2011-2012 – $\frac{32700}{3936}=8.3\%$
2012-2013 – $\frac{75000}{4804}=15.61\%$
2013-2014 – $\frac{73900}{5291}=13.97\%$
2014-2015 – $\frac{75800}{6594}=11.49\%$
2015-2016 – $\frac{95300}{7531}=12.65\%$
2016-2017 – $\frac{92800}{7996}=11.6\%$
Answer is option C.
Instructions
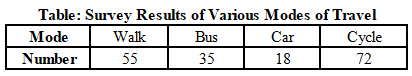
Please answer the following three questions based on the data given in the following table
and the notes below.
Notes:
A. 1 in 8 of the people who cycled to work were found to be over 65 years of age.
B. 1 in 3 of the cyclists stated that they travelled to work by bus on rainy days.
Question 4: If this data is represented in a pie chart, then how many degrees of arc in the pie chart represent each response in the survey results?
a) 4
b) 8
c) 6
d) 2
4) Answer (D)
Solution:
There are total 360 degrees in pie chart and there are total of 180 responses. Therefore, each response is represented by two degrees of arc in the pie chart.
Answer is option D.
Question 5: What is the share of respondents who cycled to work and were 65 years old?
a) 0.07
b) 0.125
c) 0.05
d) 0.4
5) Answer (C)
Solution:
Number of people who cycled to work and were 65 years old = $\frac{1}{8}\times\ 72$ = 9
Share = $\frac{9}{55+35+18+72}$ = $\frac{9}{180}$ = 0.05
Answer is option C.
Enroll to SNAP & NMAT 2022 Crash Course
Question 6: On rainy days, the ratio of people who went by bus and by cycle is approximately_____________
a) 0.75:1
b) 1:0.9
c) 1.5:1
d) 1.25:1
6) Answer (D)
Solution:
It is mentioned that 1 in 3 of the cyclists stated that they travelled to work by bus on rainy days.
On rainy days, number of people who went by bus = 35 + $\frac{1}{3}$(72) = 59
On rainy days, number of people who went by cycle = 72 – 24 = 48
Ratio = $\frac{59}{48}:1$ $\approx\ $ 1.25:1
Answer is option D.
Instructions
Read the following passage:
In 2021, IIFT has announced the “Student of the year” competition which has twosteps: – the preliminary stage and the final stage. The preliminary stage comprised of overall academic excellence in the five trimesters of the coursework. When the results of the preliminary stage were announced, it was found that only five students -Aavanya, Aarav, Saanvi, Vagisha, and Raghav qualified to compete in the final stage of “Student of the year 2021” competition. In the final stage there were five rounds of extra-curricular activities wherein the students could score from 1 to 10 points in each round. These five extra-curricular activity rounds were Debate, Extempore, Business quiz, B-plan competition, and Case Study analysis. The student with maximum points across these five rounds would be considered as winner and would take the prestigious trophy of “Student of the year 2021”.
So at the end of these five rounds of competitions, when the Jury asked for the scorecard to find out the final winner, the scorer informed them that due to some technical glitches several entries have been deleted and jury was presented with following table:
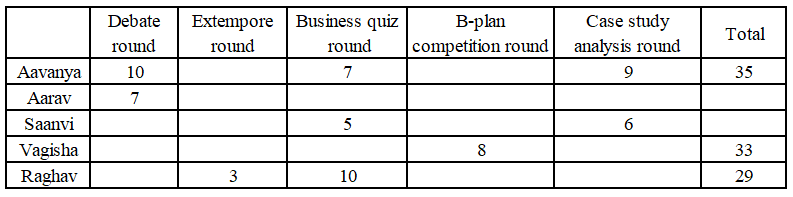
However, the scorer has made the following observations too:
(i) No two students have scored equal points in the same round.
(ii) Vagisha has scored an odd number point in case study analysis round.
(iii) Aarav’s total score point was in the multiple of 8, and it was the least among all.
(iv) There was no tie between any two students in the overall/total points.
(v) Vagisha has scored same points in the following rounds: Debate round, and Extempore round.
(vi) None of the missing scores were less than 4 in any round.
(vii) Aavanya won the competition and won the prestigious trophy of “Student of the year 2021”.
Question 7: If Aavanya scores 5 points in the B-plan competition round, and sum of twoof the three missing values for Raghav is a prime number, then which possibility iscorrect?
Possibility I: Raghav has scored 5 points in Case-study analysis round.
Possibility II: Raghav has scored 5 points in Debate round.
Possibility III: Raghav has scored 4 points in Debate round.
a) Possibility I alone is definitely false.
b) Possibility II alone is definitely true
c) Possibility III alone is definitely true.
d) All possibilities are true.
7) Answer (D)
Solution:
From statement 6, all the missing points are at least 4.
From statement 3, Aarav’s total is a multiple of 8 and is the least among the 5. The only possible score for Aarav is 24. Thus, the missing values are (4, 4, 4, 5).
Aavanya’s total score is 35 and the total of points mentioned in the table is 26. Thus, the only possible values for the blanks are 4 and 5.
From statement 1, no two students have scored equal points in the same round.
Let Vagisha’s score in the Debate and Extempore rounds be x. Thus, the table becomes as shown below.
.png)
Possibility I:
In the previous question, we have seen that Vagisha cannot score 8 in BQ. Thus, the only possibility for her score is as given in the table below.
.png)
Thus, the sum of Raghav’s points in the remaining two rounds = $29-3-10-5=11$ which is a prime number. Hence, statement 1 is a possibility.
Possibility II:
.png)
The sum of scores of BP and CP is 11, i.e. a prime number.
Thus, statement 2 is also a valid possibility.
Possibility III:
.png)
The sum of scores of BP and Debate is 11, i.e. a prime number.
Thus, statement 3 is also a valid possibility.
Hence, the answer is option D.
Question 8: Choose the correct pair of possibilities:
Possibility I: Raghav scored 8 points in debate round.
Possibility II: Vagisha’s score in extempore round is twice of Aarav in the same round.
Possibility III: Vagisha scored 6 points in the debate round.
Possibility IV: Vagisha scores more points than Aavanya in the business quiz round.
a) Possibility I and possibility II are true.
b) Possibility II and possibility III are true.
c) Only Possibility III is true.
d) Possibility I and possibility IV are true.
8) Answer (C)
Solution:
From statement 6, all the missing points are at least 4.
From statement 3, Aarav’s total is a multiple of 8 and is the least among the 5. The only possible score for Aarav is 24. Thus, the missing values are (4, 4, 4, 5).
Aavanya’s total score is 35 and the total of points mentioned in the table is 26. Thus, the only possible values for the blanks are 4 and 5.
From statement 1, no two students have scored equal points in the same round.
Let Vagisha’s score in the Debate and Extempore rounds be $x$. Thus, the table becomes as shown below.
Possibility (I): Raghav scored 8 points in the debate round.
The total value of the blanks will be = $29-8-3-10=7$. Since each of the blanks has at least 4 points, this case is not possible.
Possibility (II): Vagisha’s score in the extempore round is twice of Aarav’s in the same round.
Thus, $x=8 or 10$
If $x=8$, the total of remaining blanks = $33-8-8-8=9$. The only possible values for the blanks are 4 and 5. Since, Both BP and CP already have 4 points, Vagisha cannot get 4 points. Thus, this case is not possible.
If $x=10$, the total of remaining blanks = $33-8-10-10=5$. Thus, this case is also not possible.
Possibility (III): Vagisha scored 6 points in the debate round.
If $x=6$, the total of remaining blanks = $33-8-6-6=13$. In this case, the remaining scores can be 6 and 7, respectively, such that it satisfies the condition in statement 2. Thus, this case is possible.
Possibility (IV): Vagisha scores more points than Aavanya in the business quiz round.
Let Vagisha scores 8 points in BQ and $x=4$. Thus, Vagisha’s points in the CP round = $33-4-4-8-8=9$. Since Aavanya already scored 9 points in CP, this is not possible.
Let Vagisha scores 8 points in BQ and $x=6$. Thus, Vagisha’s points in the CP round = $33-8-6-6-8=5$. This looks plausible but in this case, Raghav’s possible points do not fit the conditions.
Similarly, for other cases, this possibility is found to be invalid.
Hence, the answer is option C.
Instructions
Read the following passage:
Ten teams have submitted their nominations for a reputed Hackathon. They were first divided in two groups of 5 teams each: Ghost Riders to The Capitalists (group 1); and Team Intelligence to Dr Bigbull (group 2). In the competition, each team from one group had to pitch their idea against the each team from another group. For example Ghost Riders will have to pitch their idea against each team in group 2. The following table gives partial information about the final scoresheet at the end of the competition:
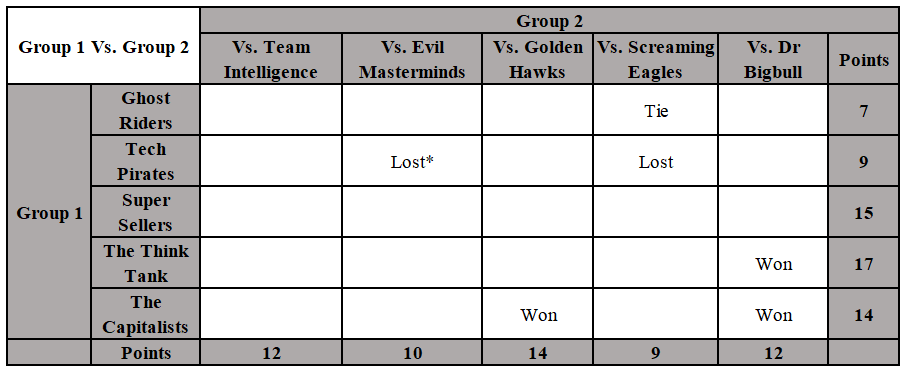
Note: * To be read as “Tech Pirates” lost the idea presentation round against “Evil Masterminds”.
For group 1 – The total points earned by each teams have been given in the last column e.g. Ghost Rider has scored 7 points overall.
For group 2 – The total points earned by each teams have been given in the last row e.g. Team Intelligence has scored 12 points overall.
In addition to this, the golden Hawks did not lose the presentation round against The Think Tank.
Point rule:
(i) If a team Wins, the winning team will get 5 points;
(ii) If there is a tie, both teams will get 2 points each; and
(iii) If a team lost the match, the losing team will get 0 points.
Question 9: Following are four statements:
I. Golden Hawks won the presentation round against Super Sellers.
II. Evil Masterminds won the presentation round against Ghost Riders.
III. Screaming Eagles won the presentation round against The Think Tank.
IV. The presentation round between The Capitalist and Team Intelligence resulted in atie.
Choose the correct option:
a) Statement I is true, and Statement II is false.
b) Both statement II and Statement IV are true.
c) Only statement I is true.
d) Only statement III is false.
9) Answer (A)
Solution:
The given table is as follows.
.png)
Consider TC’s points breakup. It won against GH and DB. It has two ties. Looking at the points breakups of the Teams in group 2, we can see that only TI and SE could have tied against TC. Thus, TC lost against EM.
Now, since SE has ties against TC and GR and won against TP, it must have lost its remaining matches.
EM won against TP and TC. Thus, it must have lost against GR, SS and TTT.
The table now becomes as given below.
.png)
GR must have lost against TI, GH and DB.
TTT could have only tied against GH. Thus, it lost against TI.
TI won against GR and TTT and tied against TC. Thus, it must have lost against TP and SS.
Thus, TP must have tied against GH and DB
SS lost against GH and DB.
Thus, the final table looks as given below.
.png)
Hence, the answer is option A.
Question 10: Tech Pirates had a tie against which of the following team(s)?
I. Team Intelligence
II. Screaming Eagles
III. Dr Bigbull
IV. Golden Hawks
Choose the correct option?
a) Only I
b) Both II and III
c) Only III
d) Both III and IV
10) Answer (D)
Solution:
The given table is as follows.
Consider TC’s points breakup. It won against GH and DB. It has two ties. Looking at the points breakups of the Teams in group 2, we can see that only TI and SE could have tied against TC. Thus, TC lost against EM.
Now, since SE has ties against TC and GR and won against TP, it must have lost its remaining matches.
EM won against TP and TC. Thus, it must have lost against GR, SS and TTT.
The table now becomes as given below.
GR must have lost against TI, GH and DB.
TTT could have only tied against GH. Thus, it lost against TI.
TI won against GR and TTT and tied against TC. Thus, it must have lost against TP and SS.
Thus, TP must have tied against GH and DB
SS lost against GH and DB.
Thus, the final table looks as given below.
Thus, TP had a tie against GH and DB.
Hence, the answer is option D.
Take SNAP mock tests here
Enrol to 10 SNAP Latest Mocks For Just Rs. 499
Question 11: What was the result of presentation round between The Think Tank and Evil Masterminds?
a) The Think Tank Lost
b) Evil Masterminds Lost
c) A tie
d) Insufficient information provided
11) Answer (B)
Solution:
The given table is as follows.
Consider TC’s points breakup. It won against GH and DB. It has two ties. Looking at the points breakups of the Teams in group 2, we can see that only TI and SE could have tied against TC. Thus, TC lost against EM.
Now, since SE has ties against TC and GR and won against TP, it must have lost its remaining matches.
EM won against TP and TC. Thus, it must have lost against GR, SS and TTT.
The table now becomes as given below.
GR must have lost against TI, GH and DB.
TTT could have only tied against GH. Thus, it lost against TI.
TI won against GR and TTT and tied against TC. Thus, it must have lost against TP and SS.
Thus, TP must have tied against GH and DB
SS lost against GH and DB.
Thus, the final table looks as given below.
Thus, Evil Masterminds lost against The Think Tank.
Hence, the answer is option B.
Instructions
The following graph provides data about the refrigerators and television sets manufactured by XYZ company in 8 days – day1 to day8. However, on each day after quality check (QC) some products were found to be defective. The attached bar chart provides data about aggregate number of refrigerators and televisions manufactured by the company and the number of refrigerators found defective after QC on each day of the given eight days.
All the televisions and refrigerators which cleared the QC were packed for selling.
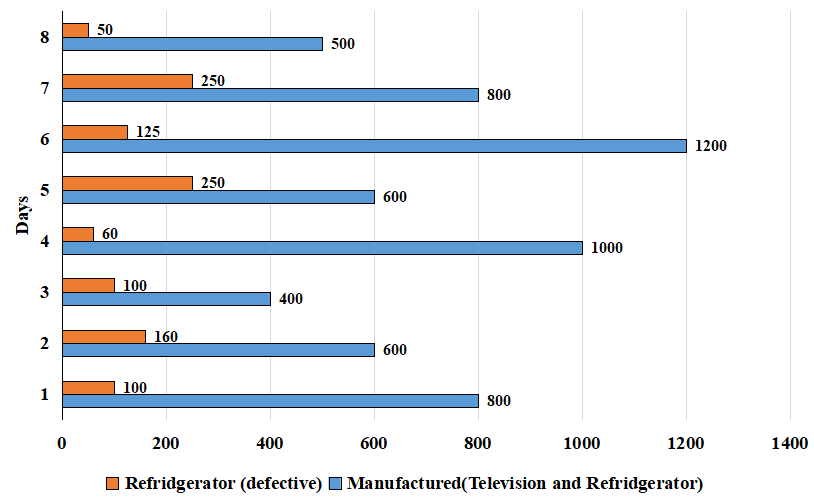
The bar chart given below provides information about the fraction of the number of televisions found defective to number of televisions which cleared the QC.

Question 12: Given that the number of televisions which cleared the quality check on each of the eight days is equal to ‘X’, then how many distinct values of X are possible?
a) 2
b) 3
c) 4
d) 5
12) Answer (B)
Solution:
The second chart provides information about the fraction of defective televisions found to the number of televisions that cleared the QC. On day 1, this ratio is 3:4, i.e. let the number of televisions found detective be ‘3a’. The number of televisions which cleared the QC is 4a, and the total number of televisions is 7a. Similarly, calculating for all the days, we will get the below data.
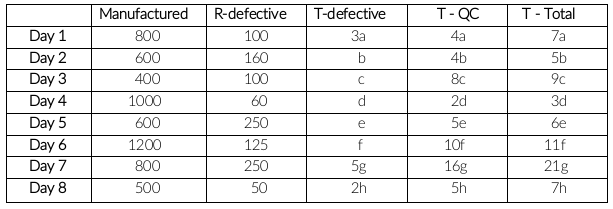
If T-QC is same for all the days, then they should be in the form of 80k. LCM(4,8,2,5,10,16,5)
X = 80k which can take only 3 values, i.e. 80, 160 and 240
Answer is option B.
Question 13: Which of the following can be the ratio of number of televisions and refrigerators which cleared the quality check on day1?
a) 1:4
b) 1:5
c) 1:6
d) 1:7
13) Answer (D)
Solution:
The second chart provides information about the fraction of defective televisions found to the number of televisions that cleared the QC. On day 1, this ratio is 3:4, i.e. let the number of televisions found detective be ‘3a’. The number of televisions which cleared the QC is 4a, and the total number of televisions is 7a. Similarly, calculating for all the days, we will get the below data.
The number of televisions which cleared quality check on day 1 = 4a
The number of refrigerators which cleared quality check on day 1 = 800 – 7a – 100 = 700 – 7a
Ratio = $\frac{4a}{700-7a}$
Only option D satisfies the above equation.
The answer is option D.
Question 14: On how many of the given 8 days the number of refrigerators which cleared the quality check can be zero?
a) 1
b) 2
c) 3
d) 5
14) Answer (B)
Solution:
The second chart provides information about the fraction of defective televisions found to the number of televisions that cleared the QC. On day 1, this ratio is 3:4, i.e. let the number of televisions found detective be ‘3a’. The number of televisions which cleared the QC is 4a, and the total number of televisions is 7a. Similarly, calculating for all the days, we will get the below data.
If the number of refrigerators which cleared the quality check is zero, then the total number of refrigerators is equal to the total number of defective refrigerators.
Televisions = Total manufactured – refrigerators
Day 1: 800 – 100 = 700 is multiple of 7a
Day 2: 600 – 160 = 440 is multiple of 5c
Similarly, calculating for the remaining days, you will get that it is only possible on day 1 and day 2.
The answer is option B.
Question 15: If the number of televisions which cleared the quality check (QC) on each of the given eight days is same, then at least how many refrigerators cleared the QC on day 3?
a) 20
b) 30
c) 25
d) 40
15) Answer (B)
Solution:
The second chart provides information about the fraction of defective televisions found to the number of televisions that cleared the QC. On day 1, this ratio is 3:4, i.e. let the number of televisions found detective be ‘3a’. The number of televisions which cleared the QC is 4a, and the total number of televisions is 7a. Similarly, calculating for all the days, we will get the below data.
If T-QC is same for all the days, then they should be in the form of 80k. LCM(4,8,2,5,10,16,5)
T-total on day 3 = 90k
T-total should be maximum to find the minimum value of refrigerators cleared QC.
T-total maximum = 270
Number of refrigerators = 400 – 270 = 130
R-QC = R-total – R-defective = 130 – 100 = 30
Answer is option B.


