
Pie Chart Questions for TISSNET
Download important TISSNET Pie Chart Questions PDF based on previously asked questions in TISSNET and other MBA exams. Practice Pie Chart Questions and answers for TISSNET and other exams.
Download Pie Chart Questions for TISSNET
Get CAT 2020 Complete Course for Rs.9999/- COUPON: NEWDECADE
Download TISSNET Previous Year Papers
Instructions
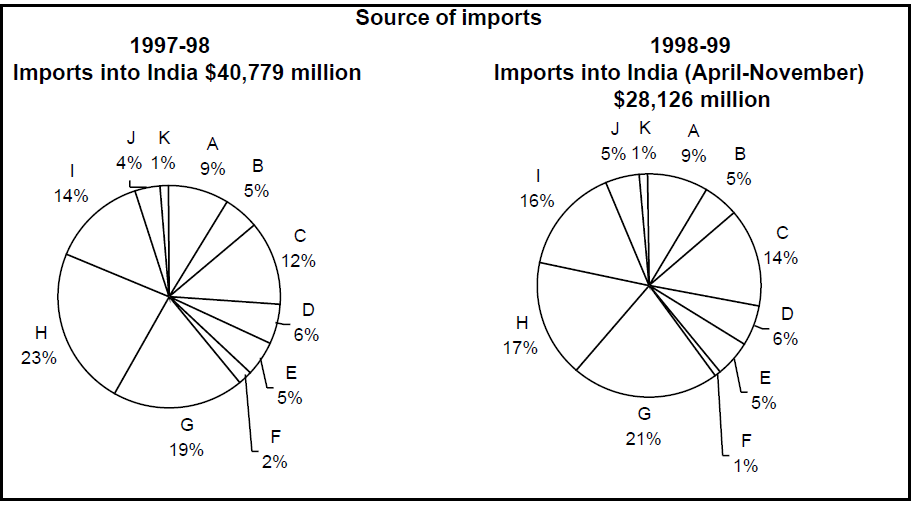
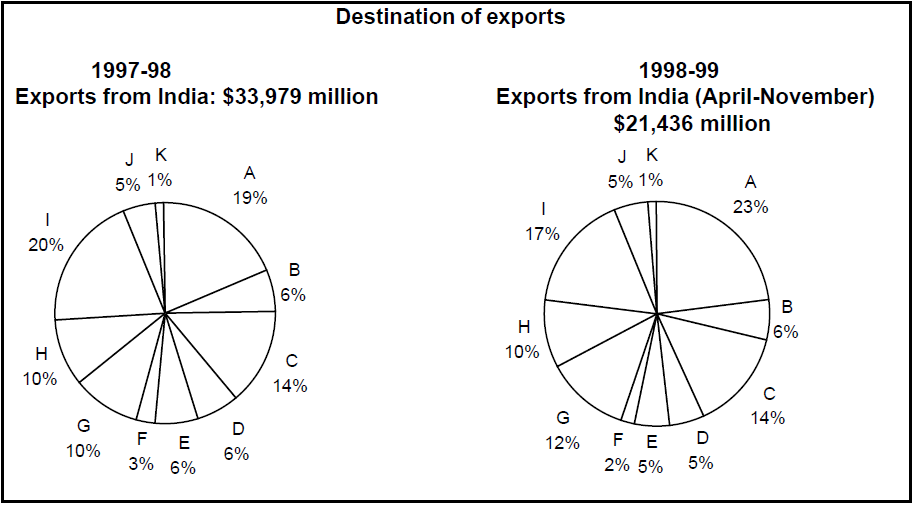
Consider the information provided in the figure below relating to India’s foreign trade in 1997-98 and the first eight months of 1998-99.
Total trade with a region is defined as the sum of exports to and imports from that region.
Trade deficit is defined as the excess of imports over exports. Trade deficit may be negative.
A:USA. B:Germany C:Other EU. D:U.K. E:Japan F:Russia
G:Other East Europe H:OPEC I:Asia J:Other LDCs K:Others
Question 1: What is the region with which India had the highest total trade in 1997-98?
a) USA
b) Other E. U.
c) OPEC
d) Others
Question 2: In 1997-98 the amount of Indian exports, in millions US $, to the region with which India had the lowest total trade, is approximately
a) 750
b) 340
c) 220
d) 440
Question 3: In 1997-98, the trade deficit with respect to India, in billions of US $, for the region with the highest trade deficit with respect to India, is approximately equal to
a) 6.0
b) 3.0
c) 4.5
d) 7.5
Question 4: What is the region with the lowest trade deficit with India in 1997-98?
a) USA
b) Asia
c) Others
d) Other E. U.
Question 5: Assume that the total exports of 1998-99 is double that of the exports done in April-November. What is the region to which Indian exports registered the highest percentage growth between 1997-98 and 1998-99?
a) Other East Europe
b) USA
c) Asia
d) Exports have declined, no growth
Download XAT Previous Papers PDF
Question 6: Assume that the total exports of 1998-99 is double that of the exports done in April-November. What is the percentage growth rate in India’s total trade deficit between 1997-98 and 1998-99?
xata) 43
b) 96
c) 91
d) 40
Instructions
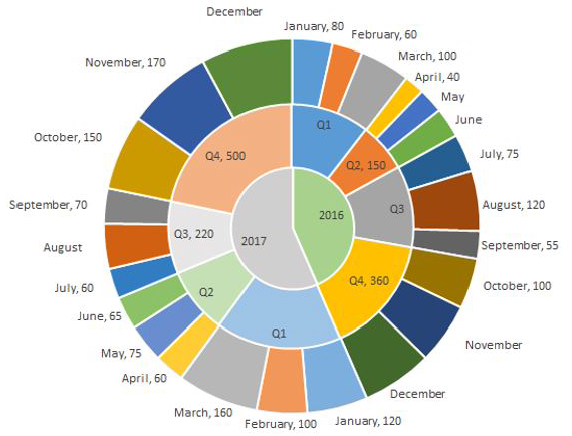
The multi-layered pie-chart below shows the sales of LED television sets for a big retail electronics outlet during 2016 and 2017. The outer layer shows the monthly sales during this period, with each label showing the month followed by sales figure of that month. For some months, the sales figures are not given in the chart. The middle-layer shows quarterwise aggregate sales figures (in some cases, aggregate quarter-wise sales numbers are not given next to the quarter). The innermost layer shows annual sales. It is known that the sales figures during the three months of the second quarter (April, May, June) of 2016 form an arithmetic progression, as do the three monthly sales figures in the fourth quarter (October, November, December) of that year.
Question 7: During which month was the percentage increase in sales from the previous month’s sales the highest?
a) March of 2017
b) October of 2017
c) March of 2016
d) October of 2016
Question 8: What is the percentage increase in sales in December 2017 as compared to the sales in December 2016?
a) 38.46
b) 22.22
c) 28.57
d) 50.00
Question 9: In which quarter of 2017 was the percentage increase in sales from the same quarter of 2016 the highest?
a) Q2
b) Q1
c) Q4
d) Q3
Question 10: During which quarter was the percentage decrease in sales from the previous quarter’s sales the highest?
a) Q2 of 2017
b) Q4 of 2017
c) Q2 of 2016
d) Q1 of 2017
Get CAT COmplete Course for Rs.9999/- COUPON: NEWDECADE
Answers & Solutions:
1) Answer (C)
The four major trading partners with India in 1997-98 are A, G, H and I.
From the numbers, we can ignore the others for this questions.
Total trade with A in the year 1997-98 is 9%*40779 + 19%*33979 = 10,126
Total trade with G in the year 1997-98 is 19%*40779 + 10%*33979 = 11,146
Total trade with H in the year 1997-98 is 23%*40779 + 10%*33979 = 12,777
Total trade with I in the year 1997-98 is 14%*40779 + 20%*33979 = 12,505
Hence, the correct option is block H which is OPEC
2) Answer (B)
In both imports and exports, India did the least amount of trade in 1997-98 with K (both equal to 1%).
Hence, India had the lowest total trade with K in the year 1997-98.
The amount of Indian exports equals 1%*33979 = 340 millions
3) Answer (A)
In order to find the trading partner with the highest trade deficit, we have to look for countries from whom India imported a lot but exported little.
The two countries which are important here are G and H. However, the exports to both are the same. But the imports from H are more than the imports from G.
So, the trading partner with whom India has the highest trade deficit is H.
The amount of trade deficit equals 23%*40779 – 10%*33979 = 5981 mio ~ 6 bn
4) Answer (A)
In order to find the country which has the least trade deficit with India, we have to look for countries whom India exported a lot and imported less.
The only two countries which fit the bill are countries A and I.
Trade deficit of A with India in 1997-98 is 19%*33979 – 9%*40779 = 2.78 billion
Trade deficit of I with India in 1997-98 is 20%*33979 – 14%*40779 = 1.08 billion
Hence, the country with the least trade deficit is country A or USA
5) Answer (B)
There are only two trade partners whose percentage of exports increased from 1997-98 to 1998-99. They are A and G.
If the total exports of 1998-99 are double that from the months April-November, total exports of the year 1998-99 is 42872.
Percentage growth in exports of country A is (23%*42872 – 19%*33979)/19%*33979 = 52.73%
Percentage growth in exports of country G is (12%*42872 – 10%*33979)/10%*33979 = 51.40%
Hence, the region to which Indian exports witnessed the highest percentage growth is region A i.e USA
6) Answer (B)
India’s trade deficit in the year 1997-98 is 40779-33979 = 6800
India’s trade deficit in the year 1998-99 is 2*(28126-21436) = 13380
Hence, the growth rate equals 13380/6800 -1 = 96%
7) Answer (B)
We have been given details about the quarterly sales figures. Also, we have been given details about the sales figures every month. Some of the data are missing and some additional conditions have been given in the question. Let us try to complete the pie chart as much as possible with the data available to us.
It is known that the sales figures during the three months of the second quarter (April, May, June) of 2016 form an arithmetic progression.
We know that the sales in April is 40.
Let the sales in May be 40+x and the sales in June be 40+2x.
We know that the total sales in Q2 is 150.
=> 40 + 40 + x + 40 + 2x = 150
3x = 30
x = 10
Therefore, sales in May 2016 = 40 + 10 = 50
Sales in June 2016 = 40 + 20 = 60
Similarly, it has been given that the sales in October, November, and December 2016 form an arithmetic progression.
Sales in October = 100
Sales in Q4 = 360
Let the sales in November be 100+y and the sales in December be 100+2y.
100 + 100 + y + 100 + 2y = 360
300 + 3y = 360
=> y = 20
Sales in November 2016 = 120 and Sales in December 2016 = 140
Sales in Q1 of 2016 = Sum of the sales in the months of January, February, and March 2016
= 80 + 60 + 100
= 240
Sales in Q3 of 2016 = Sum of the sales in the months of July, August, and September 2016
= 75 + 120 + 55
= 250
Sales in Q1 of 2017 = 120 + 100 + 160 = 380
Sales in Q2 of 2017 = 65 + 75 + 60 = 200
We know that sales in Q3 of 2017 = 220
Let the sales in August of 2017 be ‘a’.
60 + 70 + a = 220
=> a = 90
Sales in August 2017 = 90
We know that sales in Q4 of 2017 = 500
Let the sales in December of 2017 be ‘d’.
150 + 170 + d = 500
=> d = 180
Sales in December 2017 = 180

March of 2017:
Sales in March of 2017 = 160
Sales in February of 2017 = 100
% increase = 60/100 = 60%
October of 2017:
Sales in October of 2017 = 150
Sales in September of 2017 = 70
As we can see, the sales has increased by more than 100%.
March of 2016:
Sales in March of 2016 = 100
Sales in February of 2016 = 60
% increase in sales is less than 100%.
October of 2016:
Sales in October of 2016 = 100
Sales in September of 2016 = 55
% increase is less than 100%
As we can see, the percentage increase in sale as compared to the previous month was highest in October of 2017 among the given options. Therefore, option B is the right answer.
8) Answer (C)
We have been given details about the quarterly sales figures. Also, we have been given details about the sales figures every month. Some of the data are missing and some additional conditions have been given in the question. Let us try to complete the pie chart as much as possible with the data available to us.
It is known that the sales figures during the three months of the second quarter (April, May, June) of 2016 form an arithmetic progression.
We know that the sales in April is 40.
Let the sales in May be 40+x and the sales in June be 40+2x.
We know that the total sales in Q2 is 150.
=> 40 + 40 + x + 40 + 2x = 150
3x = 30
x = 10
Therefore, sales in May 2016 = 40 + 10 = 50
Sales in June 2016 = 40 + 20 = 60
Similarly, it has been given that the sales in October, November, and December 2016 form an arithmetic progression.
Sales in October = 100
Sales in Q4 = 360
Let the sales in November be 100+y and the sales in December be 100+2y.
100 + 100 + y + 100 + 2y = 360
300 + 3y = 360
=> y = 20
Sales in November 2016 = 120 and Sales in December 2016 = 140
Sales in Q1 of 2016 = Sum of the sales in the months of January, February, and March 2016
= 80 + 60 + 100
= 240
Sales in Q3 of 2016 = Sum of the sales in the months of July, August, and September 2016
= 75 + 120 + 55
= 250
Sales in Q1 of 2017 = 120 + 100 + 160 = 380
Sales in Q2 of 2017 = 65 + 75 + 60 = 200
We know that sales in Q3 of 2017 = 220
Let the sales in August of 2017 be ‘a’.
60 + 70 + a = 220
=> a = 90
Sales in August 2017 = 90
We know that sales in Q4 of 2017 = 500
Let the sales in December of 2017 be ‘d’.
150 + 170 + d = 500
=> d = 180
Sales in December 2017 = 180
Sales in December 2016 = 140
Sales in December 2017 = 180
Percentage change = (180-140)/140 = 40/140 = 28.57%
Therefore, option C is the right answer.
9) Answer (B)
We have been given details about the quarterly sales figures. Also, we have been given details about the sales figures every month. Some of the data are missing and some additional conditions have been given in the question. Let us try to complete the pie chart as much as possible with the data available to us.
It is known that the sales figures during the three months of the second quarter (April, May, June) of 2016 form an arithmetic progression.
We know that the sales in April is 40.
Let the sales in May be 40+x and the sales in June be 40+2x.
We know that the total sales in Q2 is 150.
=> 40 + 40 + x + 40 + 2x = 150
3x = 30
x = 10
Therefore, sales in May 2016 = 40 + 10 = 50
Sales in June 2016 = 40 + 20 = 60
Similarly, it has been given that the sales in October, November, and December 2016 form an arithmetic progression.
Sales in October = 100
Sales in Q4 = 360
Let the sales in November be 100+y and the sales in December be 100+2y.
100 + 100 + y + 100 + 2y = 360
300 + 3y = 360
=> y = 20
Sales in November 2016 = 120 and Sales in December 2016 = 140
Sales in Q1 of 2016 = Sum of the sales in the months of January, February, and March 2016
= 80 + 60 + 100
= 240
Sales in Q3 of 2016 = Sum of the sales in the months of July, August, and September 2016
= 75 + 120 + 55
= 250
Sales in Q1 of 2017 = 120 + 100 + 160 = 380
Sales in Q2 of 2017 = 65 + 75 + 60 = 200
We know that sales in Q3 of 2017 = 220
Let the sales in August of 2017 be ‘a’.
60 + 70 + a = 220
=> a = 90
Sales in August 2017 = 90
We know that sales in Q4 of 2017 = 500
Let the sales in December of 2017 be ‘d’.
150 + 170 + d = 500
=> d = 180
Sales in December 2017 = 180
Among the given 4 options, we have to find the quarter in which the increase in sale from the previous quarter was the highest.
Q2:
Sales in 2017 = 200
Sales in 2016 = 150
Q1:
Sales in 2017 = 380
Sales in 2016 = 240
Q3:
Sales in 2017 = 220
Sales in 2016 = 250
Q4:
Sales in 2017 = 500
Sales in 2016 = 360
We can eliminate Q3 since the sales has decreased.
Growth in Q2 sales = 50/150 = 1/3 = 33.33%
Growth in Q1 sales = (380-240)/240 = 140/240 = 58.33%
Growth in Q4 sales = (500-360)/360 = 140/360
140/240 > 140/360
Therefore, Q1 has recorded the highest growth in sales and hence, option B is the right answer.
10) Answer (A)
We have been given details about the quarterly sales figures. Also, we have been given details about the sales figures every month. Some of the data are missing and some additional conditions have been given in the question. Let us try to complete the pie chart as much as possible with the data available to us.
It is known that the sales figures during the three months of the second quarter (April, May, June) of 2016 form an arithmetic progression.
We know that the sales in April is 40.
Let the sales in May be 40+x and the sales in June be 40+2x.
We know that the total sales in Q2 is 150.
=> 40 + 40 + x + 40 + 2x = 150
3x = 30
x = 10
Therefore, sales in May 2016 = 40 + 10 = 50
Sales in June 2016 = 40 + 20 = 60
Similarly, it has been given that the sales in October, November, and December 2016 form an arithmetic progression.
Sales in October = 100
Sales in Q4 = 360
Let the sales in November be 100+y and the sales in December be 100+2y.
100 + 100 + y + 100 + 2y = 360
300 + 3y = 360
=> y = 20
Sales in November 2016 = 120 and Sales in December 2016 = 140
Sales in Q1 of 2016 = Sum of the sales in the months of January, February, and March 2016
= 80 + 60 + 100
= 240
Sales in Q3 of 2016 = Sum of the sales in the months of July, August, and September 2016
= 75 + 120 + 55
= 250
Sales in Q1 of 2017 = 120 + 100 + 160 = 380
Sales in Q2 of 2017 = 65 + 75 + 60 = 200
We know that sales in Q3 of 2017 = 220
Let the sales in August of 2017 be ‘a’.
60 + 70 + a = 220
=> a = 90
Sales in August 2017 = 90
We know that sales in Q4 of 2017 = 500
Let the sales in December of 2017 be ‘d’.
150 + 170 + d = 500
=> d = 180
Sales in December 2017 = 180
Q2 of 2017:
Sales in Q2 of 2017 = 200
Sales in Q1 of 2017 = 380
% decrease = 180/380
Q4 of 2017:
We can eliminate this option since the sales has increased in Q4 of 2017 as compared to the previous quarter.
Q2 of 2016:
Sales in Q2 of 2016 = 150
Sales in Q1 of 2016 = 240
% decrease = 90/240
Q1 of 2017:
Sales in Q1 of 2017 has increased as compared to sales in the previous quarter. We can eliminate this option as well.
180/380 is very close to 50%. 90/240 is closer to 33.33%. Therefore, option A is the right answer.
TISSNET Solved Previous papers
We hope this Pie Chart Questions PDF for TISSNET with Solutions will be helpful to you.


