
Download Pie Chart Questions For IBPS PO PDF
Take a free mock test for IBPS PO
Download IBPS PO Previous Papers PDF
Question 1: The pie chart given below shows the time taken in 7 different procedures J1, J2, J3, J4, J5, J6 and J7 in making a car as a percentage of total time taken. The total time taken in making one car is 1200 hours.

What will be the total taken in procedures J2 and J5?
a) 396 hours
b) 240 hours
c) 312 hours
d) 360 hours
Question 2: The pie chart given below shows the time taken in 7 different procedures J1, J2, J3, J4, J5, J6 and J7 in making a car as a percentage of total time taken. The total time taken in making one car is 1200 hours.

What is the difference between the time taken in processes J1 and J4?
a) 96 hours
b) 72 hours
c) 60 hours
d) 84 hours
Question 3:


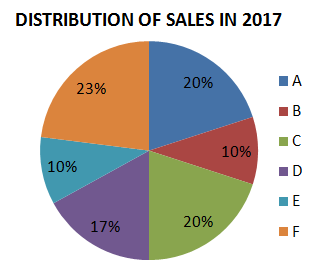
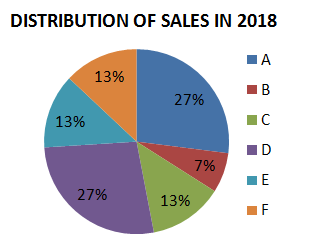
The pie charts shows the percentage market share of different companies in the market for the year 2017 and 2018. The total sale increased from 150 crores to 225 crores during 2017 to 2018. What is the ratio of sales of Company D in the year 2018 to its sales in the year 2017?
a) 16 : 21
b) 21 : 16
c) 27 : 20
d) 20 : 27
IBPS PO Quant Formulas & Shortcuts
Question 4: The pie charts show the market share of companies in the rice market in 2017 and 2018. The value of sales of Company A in 2017 was ₹40 lakhs. If its sales grew by 25% in 2018, what was approximate value of sales of company B in 2018?
a) ₹12.56 lakhs
b) ₹13.96 lakhs
c) ₹12.96 lakhs
d) ₹13.56 lakhs
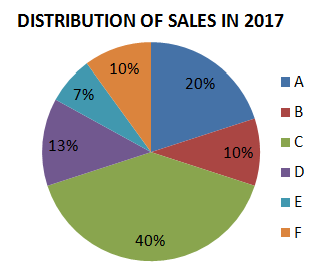
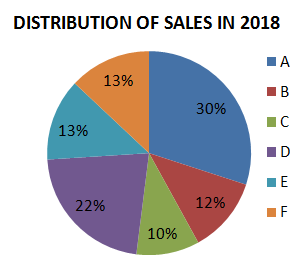
Question 5: The pie charts show the market share of the companies in the detergent market in 2017 and 2018. The total size of the market has decreased from ₹ 300 crores to ₹ 200 crores. What is the decrease in the sales of Company F?
a) $14\frac{1}{3}$%
b) $12\frac{1}{3}$%
c) $33\frac{1}{3}$%
d) $13\frac{1}{3}$%
Question 6: Study the chart and answer the question based, on the pie chart.
The pie chart given below shows expenditures incurred by a family on various items and savings in a month. Savings of the family is ₹ 8,000 in a month.

The ratio of the expenditure on food to the savings is:
a) 2:1
b) 3:4
c) 3:2
d) 4:3
Question 7: Study the chart and answer the question based, on the pie chart.
The pie chart given below shows expenditures incurred by a family on various items and savings in a month. Savings of the family is ₹ 8,000 in a month.

How much more amount is spent on food than on housing?
a) ₹2,000
b) ₹3,000
c) ₹1,000
d) ₹2,500
Question 8: Study the chart and answer the question based, on the pie chart.
The pie chart given below shows expenditures incurred by a family on various items and savings in a month. Savings of the family is ₹ 8,000 in a month.

What is the total expenditure of the family for the month?
a) ₹45,000
b) ₹48,000
c) ₹50,000
d) ₹40,000
Question 9: DIRECTION: The population of a city is 8000. They have various types of occupation which is given below by the pie-chart. Study the pie-chart and answer the given questions.

The ratio of people working in service to industry sectors respectively:
a) 2:3
b) 3:5
c) 3:4
d) 5:3
Question 10: DIRECTION:The population of a city is 8000. They have various types of occupation which is given below by the pie-chart. Study the pie-chart and answer the given questions.

How much population percent is less in industry sector than in agriculture sector?
a) 10%
b) 25%
c) 15%
d) 20%
IBPS PO Previous Papers (Download Pdf)
Answers & Solutions:
1) Answer (D)
Percentage of time taken in J2 = 18%
Percentage of time taken in J5 = 12%
Total time taken = 12+18 = 30% of 1200 = 360 hours
2) Answer (B)
Percentage of time required for J1 = 14%
Percentage of time required for J4 = 8%
Required difference = 14-8 = 6% of 1200 = 72 hours
3) Answer (C)
Sales of D in 2018 = $\dfrac{27}{100} \times 225$
Sales of D in 2017 = $\dfrac{30}{100} \times 150$
Then, Required ratio = $\dfrac{27}{100} \times 225 : \dfrac{30}{100} \times 150 = 27 : 20$
4) Answer (C)
Value of sales of Company A in 2017 = Rs.40 lakhs
Value of sales of Company A in 2018 = 125% of Rs.40 lakhs = Rs.50 lakhs which is 27% of sales of all companies
27% –> Rs.50 lakhs
7% –> $\dfrac{7 \times 50}{27} = 12.96$ lakhs
5) Answer (D)
Sales of Company F in 2017 = 10% of Rs.300 crore = Rs.30 crore
Sales of Company F in 2018 = 13% of Rs.200 crore = Rs.26 crore
Decrease in sales = $\dfrac{30-26}{30}\times100 = \dfrac{40}{3}$% $= 13\dfrac{1}{3}$%
6) Answer (A)
The angle subtended by food at the center is 120 degrees and by savings is 60 degrees
Therefore required ratio=120/60
=2:1
7) Answer (A)
let x be total income
Given (60/360)*x=8000
x=48000
difference between food and housing is 120-105=15 degrees
60 degrees=8000
15 degrees=2000
8) Answer (D)
Given 60 degrees=Rs 8000
360 degrees=Rs 48000
Total expenditure=Rs 48000
9) Answer (A)
Total share of service sector=72 degrees
Total share of industry sector=108 degrees
Ratio=2:3
10) Answer (A)
The share of industry sector=108 degrees
The share of agriculture sector=120 degrees
Percent greater=((120-108)/120)*100
=10%

 Out – Direct link to Download")

