
Pie chart questions are a common type of Data Interpretation (DI) questions in the Data Interpretation and Logical Reasoning (LRDI) section of the CAT exam. These questions require a good understanding of how to interpret and analyze data presented in pie charts. To help CAT aspirants prepare for this topic, we are offering a collection of Pie Chart Questions for CAT. In this article, we will provide you with the most important pie chart questions. By studying these questions, aspirants can improve their proficiency in solving pie chart-related problems and increase their chances of securing a higher score in the LRDI section of the CAT exam.
Download CAT Pie charts Set-1 PDF
Download Data Interpretation CAT Questions PDF
More Questions for Practice on DI-Pie charts
Instructions: (1 to 3)
For the following three questions: Answer the questions based on the pie charts given below.
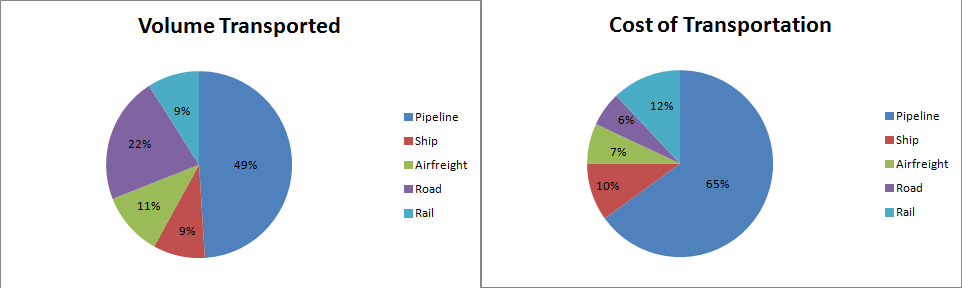
Chart 1 shows the distribution of 12 million tonnes of crude oil transported through different modes over a specific period of time.
Chart 2 shows the distribution of the cost of transporting this crude oil. The total cost was Rs. 30 million.
Question 1:
The cost in rupees per tonne of oil moved by rail and road happens to be roughly
a) Rs. 3
b) Rs. 1.5
c) Rs. 4.5
d) Rs. 8
Question 2:
From the charts given, it appears that the cheapest mode of transport is
a) road
b) rail
c) pipeline
d) ship
Question 3:
If the costs per tonne of transport by ship, air and road are represented by P, Q and R respectively, which of the following is true?
a)R > Q > P
b)P > R > Q
c)P > Q > R
d)R > P > Q
Solutions: (1 to 3)
1) Answer (b)
Total tonnes of transportation by both rail and road is about 31*12/100 = 3.72 million tonnes and total cost incured 18*30/100 = 5.4 .
Hence required value is 5.4/3.72 which is about 1.5.
Hence option B .
2) Answer (a)
Cheapest mode of transport will be the one which will have highest transport volume and comparatively lowest cost. We can figure out from the graph that Road have wide gap with very less costs.
For Road, Cost = 6/22
For Rail, Cost = 12/9
For Pipeline, = 65/49
For Ship, Cost = 10/9
Lowest cost is for road.
Download CAT 2022 Syllabus PDF
Preparation tips for CAT – Beginners
3) Answer (c)
If the costs per tonne of transport by ship, air and road are represented by P, Q and R respectively.
P = 10/9
Q = 7/11
R = 6/22
We can see that P>Q and Q>R and P>R. Hence option C.
Instructions: 4 to 5
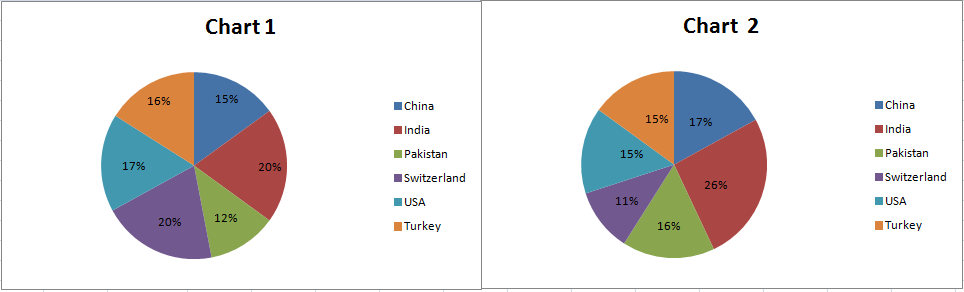
Chart 1 shows the distribution by value of top 6 suppliers of MFA Textiles in 1995.
Chart 2 shows the distribution by quantity of top 6 suppliers of MFA Textiles in 1995.
The total value is 5760 million Euro (European currency). The total quantity is 1.055 million tonnes.
Question 4:
The country which has the highest average price is
a) USA
b) Switzerland
c) Turkey
d) India
Download Quantitative Ability for CAT
Question 5:
The average price in Euro per kilogram for Turkey is roughly
a) 6.20
b) 5.60
c) 4.20
d) 4.80
Solutions: (4 to 5)
4) Answer (b)
The country which has the highest average price would have low quality and high value when compared to other countries..
Switzerland fits the above description.
Hence, option B is the answer.
5) Answer (b)
Turkey has a value of 16% and a quantity of 15%.
The average price in Euro per kilogram for Turkey is (16*5.760)/(15*1.055) which is nearly equal to 5.6.
Hence option B.


[…] Pie Chart questions – 2nd February, 2018 […]