")
Data Interpretation (Graphs) Questions for MAH-CET
Here you can download a free Data Interpretation (Graphs) questions PDF with answers for MAH MBA CET 2022 by Cracku. These are some tricky questions in the MAH MBA CET 2022 exam that you need to find the Data Interpretation (Graphs) of answers for the given questions. These questions will help you to make practice and solve the Data Interpretation (Graphs) questions in the MAH MBA CET exam. Utilize this best PDF practice set which is included answers in detail. Click on the below link to download the Data Interpretation (Graphs) MCQ PDF for MBA-CET 2022 for free.
Download Data Interpretation (Graphs) Questions for MAH-CET
Enroll to MAH-CET 2022 Crash Course
Instructions
The following graph provides data about the refrigerators and television sets manufactured by XYZ company in 8 days – day1 to day8. However, on each day after quality check (QC) some products were found to be defective. The attached bar chart provides data about aggregate number of refrigerators and televisions manufactured by the company and the number of refrigerators found defective after QC on each day of the given eight days.
All the televisions and refrigerators which cleared the QC were packed for selling.
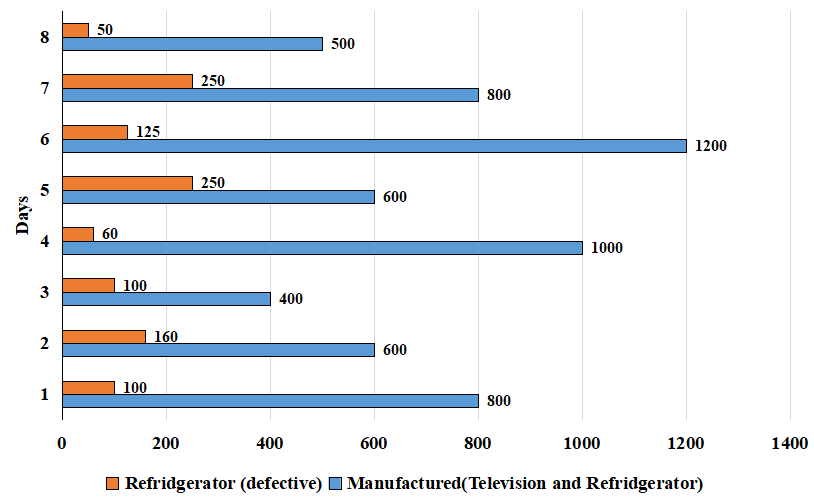
The bar chart given below provides information about the fraction of the number of televisions found defective to number of televisions which cleared the QC.

Question 1: Given that the number of televisions which cleared the quality check on each of the eight days is equal to ‘X’, then how many distinct values of X are possible?
a) 2
b) 3
c) 4
d) 5
1) Answer (B)
Solution:
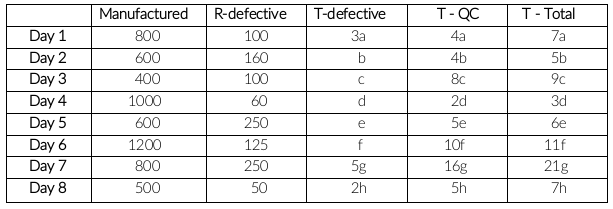
The second chart provides information about the fraction of defective televisions found to the number of televisions that cleared the QC. On day 1, this ratio is 3:4, i.e. let the number of televisions found detective be ‘3a’. The number of televisions which cleared the QC is 4a, and the total number of televisions is 7a. Similarly, calculating for all the days, we will get the below data.
If T-QC is same for all the days, then they should be in the form of 80k. LCM(4,8,2,5,10,16,5)
X = 80k which can take only 3 values, i.e. 80, 160 and 240
Answer is option B.
Question 2: Which of the following can be the ratio of number of televisions and refrigerators which cleared the quality check on day1?
a) 1:4
b) 1:5
c) 1:6
d) 1:7
2) Answer (D)
Solution:
The second chart provides information about the fraction of defective televisions found to the number of televisions that cleared the QC. On day 1, this ratio is 3:4, i.e. let the number of televisions found detective be ‘3a’. The number of televisions which cleared the QC is 4a, and the total number of televisions is 7a. Similarly, calculating for all the days, we will get the below data.
The number of televisions which cleared quality check on day 1 = 4a
The number of refrigerators which cleared quality check on day 1 = 800 – 7a – 100 = 700 – 7a
Ratio = $\frac{4a}{700-7a}$
Only option D satisfies the above equation.
The answer is option D.
Question 3: On how many of the given 8 days the number of refrigerators which cleared the quality check can be zero?
a) 1
b) 2
c) 3
d) 5
3) Answer (B)
Solution:
The second chart provides information about the fraction of defective televisions found to the number of televisions that cleared the QC. On day 1, this ratio is 3:4, i.e. let the number of televisions found detective be ‘3a’. The number of televisions which cleared the QC is 4a, and the total number of televisions is 7a. Similarly, calculating for all the days, we will get the below data.
If the number of refrigerators which cleared the quality check is zero, then the total number of refrigerators is equal to the total number of defective refrigerators.
Televisions = Total manufactured – refrigerators
Day 1: 800 – 100 = 700 is multiple of 7a
Day 2: 600 – 160 = 440 is multiple of 5c
Similarly, calculating for the remaining days, you will get that it is only possible on day 1 and day 2.
The answer is option B.
Question 4: If the number of televisions which cleared the quality check (QC) on each of the given eight days is same, then at least how many refrigerators cleared the QC on day 3?
a) 20
b) 30
c) 25
d) 40
4) Answer (B)
Solution:
The second chart provides information about the fraction of defective televisions found to the number of televisions that cleared the QC. On day 1, this ratio is 3:4, i.e. let the number of televisions found detective be ‘3a’. The number of televisions which cleared the QC is 4a, and the total number of televisions is 7a. Similarly, calculating for all the days, we will get the below data.
If T-QC is same for all the days, then they should be in the form of 80k. LCM(4,8,2,5,10,16,5)
T-total on day 3 = 90k
T-total should be maximum to find the minimum value of refrigerators cleared QC.
T-total maximum = 270
Number of refrigerators = 400 – 270 = 130
R-QC = R-total – R-defective = 130 – 100 = 30
Answer is option B.
Instructions
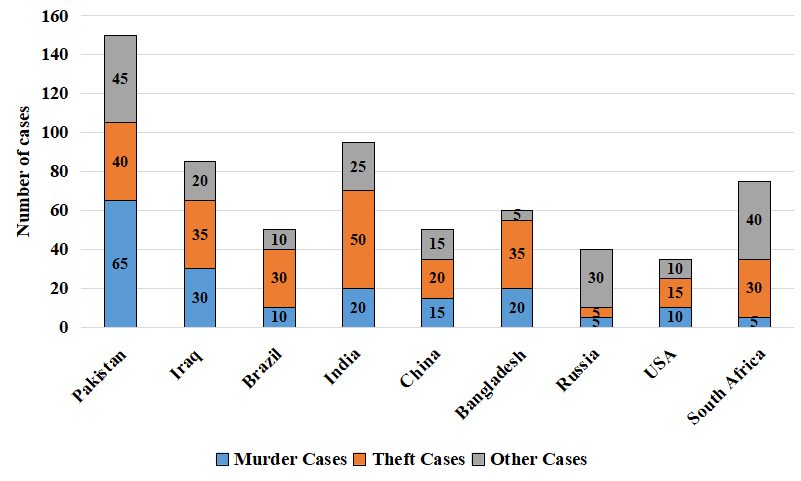
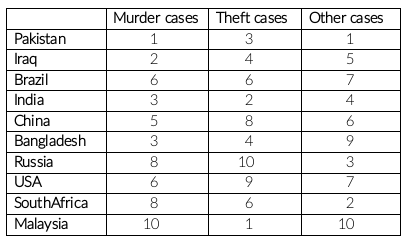
The graph below depicts the crime cases registered against foreigners in different countries in a given year. The crime cases are classified into three categories: Murder cases, theft cases and other cases. The data for nine countries are shown in the figure below. These nine countries belong to the top ten countries in terms of the total number of cases registered. The tenth country is Malaysia, where only 523 theft cases were registered.
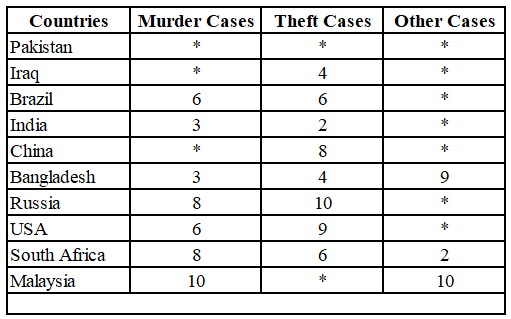
The table below shows the rank of the ten countries in terms of the number of cases registered in each of the three categories of crimes. If two countries are assigned rank2nd, then for any given crime, 3rd rank cannot be assigned to any country.
Question 5: The sum of the ranks of Pakistan in the three categories of crimes is?
a) 4
b) 7
c) 5
d) 10
5) Answer (C)
Solution:
The number of murder cases in Pakistan is greater than the number of murder cases in Iraq, and the number of murder cases in Iraq is greater than the number of murder cases in China. Therefore, the rank of Pakistan is 1 and the rank of Iraq is 2. As the ranks of India and Bangladesh are 3, the rank of China will be 5.
It is given that the number of theft cases in Malaysia is 523. Therefore, the rank of Malaysia is 1. The rank of Pakistan in theft cases can be 2 or 3. The number of theft cases in Pakistan is less than the number of theft cases in India. Therefore, the rank of Pakistan is 3.
Similarly, checking the values from the graph and ranking countries for other cases.
Final table:
The sum of ranks of Pakistan in three categories = 1 + 3 + 1 = 5
Answer is option C.
Take Free MAH-CET mock tests here
Enrol to 5 MAH CET Latest Mocks For Just Rs. 299
Question 6: Which of the following is correct about the ranks of countries in the other crimes category?
i) USA: 7
ii) Russia: 3
a) Only (i) is correct
b) Only (ii) is correct
c) Both (i) and (ii) are correct
d) Both (i) and (ii) are incorrect
6) Answer (C)
Solution:
The number of murder cases in Pakistan is greater than the number of murder cases in Iraq, and the number of murder cases in Iraq is greater than the number of murder cases in China. Therefore, the rank of Pakistan is 1 and the rank of Iraq is 2. As the ranks of India and Bangladesh are 3, the rank of China will be 5.
It is given that the number of theft cases in Malaysia is 523. Therefore, the rank of Malaysia is 1. The rank of Pakistan in theft cases can be 2 or 3. The number of theft cases in Pakistan is less than the number of theft cases in India. Therefore, the rank of Pakistan is 3.
Similarly, checking the values from the graph and ranking countries for other cases.
Final table:
The rank of USA in other crimes is 7 and the rank of Russia in other crimes is 3. Therefore, both (i) and (ii) are correct.
Answer is option C.
Question 7: In the top two countries on the basis of total registered cases, the approximate ratio of total number of murder cases to total number of theft cases is
a) 1:6
b) 1:7
c) 1:9
d) 1:4
7) Answer (C)
Solution:
The number of murder cases in Pakistan is greater than the number of murder cases in Iraq, and the number of murder cases in Iraq is greater than the number of murder cases in China. Therefore, the rank of Pakistan is 1 and the rank of Iraq is 2. As the ranks of India and Bangladesh are 3, the rank of China will be 5.
It is given that the number of theft cases in Malaysia is 523. Therefore, the rank of Malaysia is 1. The rank of Pakistan in theft cases can be 2 or 3. The number of theft cases in Pakistan is less than the number of theft cases in India. Therefore, the rank of Pakistan is 3.
Similarly, checking the values from the graph and ranking countries for other cases.
Final table:
The sum of murder cases in top two countries = 0 + 65 = 65
The sum of theft cases in top two countries = 523 + 40 = 563
Ratio = 65:563 = 1 : 8.66 $\approx\ $ 1 : 9
Answer is option C.
Question 8: The rank of China in the murder cases category is?
a) $2^{nd}$
b) $5^{th}$
c) $7^{th}$
d) $8^{th}$
8) Answer (B)
Solution:
The number of murder cases in Pakistan is greater than the number of murder cases in Iraq, and the number of murder cases in Iraq is greater than the number of murder cases in China. Therefore, the rank of Pakistan is 1 and the rank of Iraq is 2. As the ranks of India and Bangladesh are 3, the rank of China will be 5.
It is given that the number of theft cases in Malaysia is 523. Therefore, the rank of Malaysia is 1. The rank of Pakistan in theft cases can be 2 or 3. The number of theft cases in Pakistan is less than the number of theft cases in India. Therefore, the rank of Pakistan is 3.
Similarly, checking the values from the graph and ranking countries for other cases.
Final table:
The rank of China in murder cases is 5.
Answer is option B.
Instructions
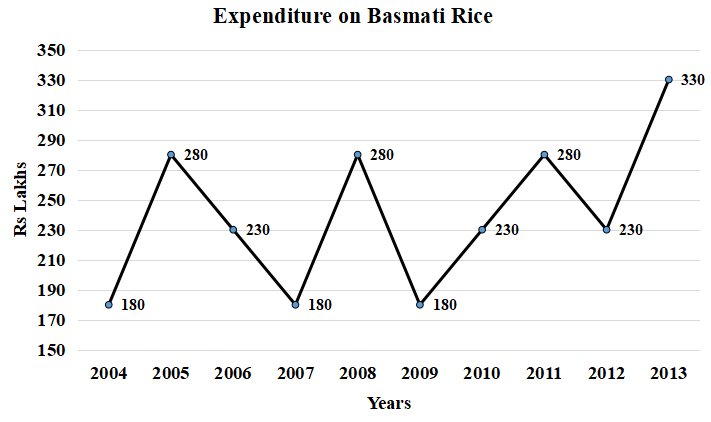
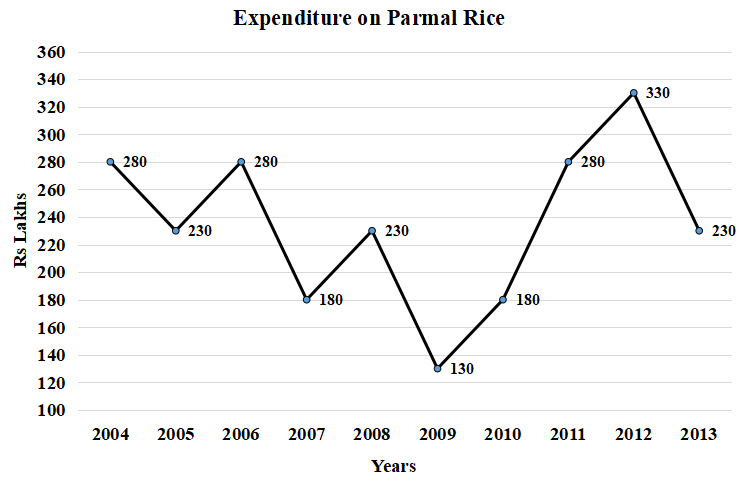
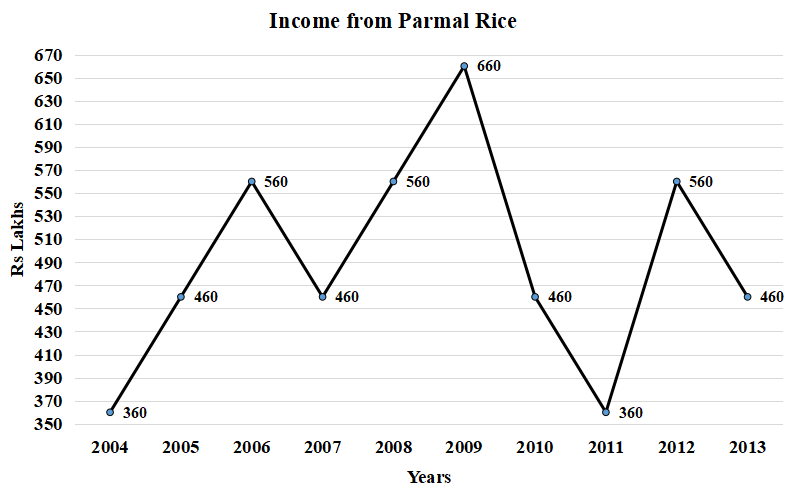
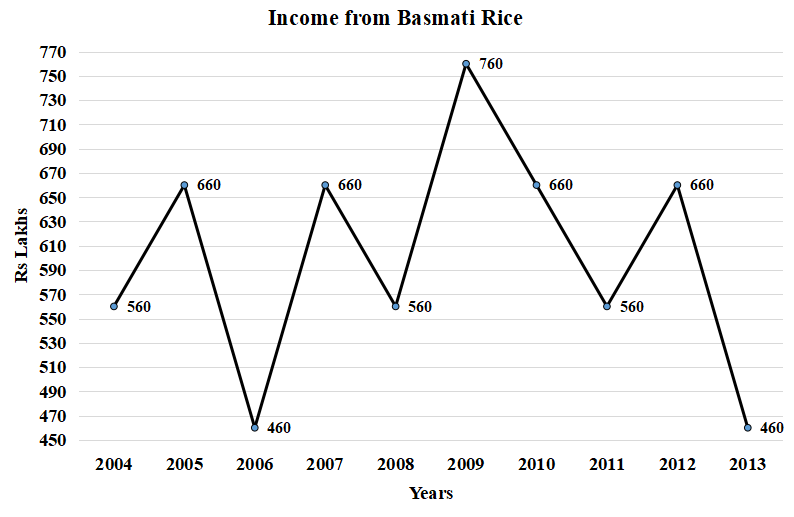
Refer to the following line charts and solve the questions based on them. The line charts given below give the expenditure and income of ABC Ltd. Which produces and sells only two variants of its rice – Basmati rice and Parmal rice.
Question 9: In which year the annual percentage decrease in the profit of parmal rice ismaximum as compared to that of the previous year?
a) 2009
b) 2010
c) 2011
d) 2013
9) Answer (C)
Solution:
Profit for 2008 = 330
Profit for 2009 = 530
Profit for 2010 = 280
Profit for 2011 = 80
Profit for 2012 = 230
Profit for 2013 = 230
From the above trend, we can observe that the maximum decrease is in the year 2011.
Hence, the answer is option C.
Question 10: The percentage annual increase in the income of Basmati rice is highest inwhich of the following years?
a) 2005
b) 2007
c) 2009
d) 2012
10) Answer (B)
Solution:
Option A: For 2005 = $\frac{660-560}{560}\times100=\frac{10000}{560}=17.85\%$
Option B: For 2007 = $\frac{660-460}{460}\times100=\frac{20000}{460}=43.47\%$
Option C: For 2009 = $\frac{760-560}{560}\times100=\frac{20000}{560}=35.71\%$
Option D: For 2012 = $\frac{660-560}{560}\times100=\frac{10000}{560}=17.85\%$
Hence, the answer is option B.
Question 11: Calculate the number of years during 2005 to 2013 for atleast one of thetwo rice when income and expenditure did not follow the same trend (i.e both incomeand expenditure did not increase or decrease simultaneously compared to theprevious year)?
a) 5
b) 6
c) 8
d) 9
11) Answer (C)
Solution:
We have to count the years in which at least one of the rice’s income and expenditure shows an opposite trend.
2005: Parmal rice has an opposite trend.
2006: None of the rice has opposite trends.
2007: Basmati rice has an opposite trend.
2008: Basmati rice has an opposite trend.
2009: Both the rice show an opposite trend.
2010: Both the rice show an opposite trend.
2011: Both the rice show an opposite trend.
2012: Basmati rice has an opposite trend.
2013: Basmati rice has an opposite trend.
Thus, all the years except 2008 have at least one rice showing an opposite trend in income and expenditure.
Thus, there are a total of 8 years.
Hence, the answer is option C.
Question 12: The total profit of ABC Ltd. is highest in which of the following years?
a) 2007
b) 2009
c) 2012
d) 2004
12) Answer (B)
Solution:
Option A: Profits for 2007 = 1120 – 360 = 760
Option B: Profits for 2009 = 1420 – 310 = 1110
Option C: Profits for 2012 = 1220 – 560 = 660
Option D: Profits for 2004 = 920 – 460 = 460
Thus, the maximum profit is in the year 2009.
Hence, the answer is option B.
Instructions
Read the following passage:
D Techno, a small firm, has eight employees (Employee IDs 1001 to 1008) working in three departments(Department A, Department B and Department C) who are involved in various planning and executionprocesses of the firm. Department C has more employees than other two departments. Most of theseemployees are involved in both, planning and execution processes, whereas remaining employees are involved in either planning or execution processes only. Employees are rated for their performance usingsix Key Performance Indicators (KPI), three indicators for performance in three planning processes(Planning KPI1 to Planning KPI3) and three indicators for performance in execution processes(ExecutionKPI1 to ExecutionKPI3). Rating varies from zero to ten where ten indicates best performance(Fig A and Fig B). Planning Average Rating is derived as average of all three Planning KPI Ratings andExecution Average Rating is average of all three Execution KPI Ratings (Fig C). Final Weighted Rating isweighted sum of Planning Average Rating and Execution Average Rating. Each department uses its own weightages for planning and execution KPIs to calculate Final Weighted Rating . One of the departmentsgives 40% weightage to Planning Average Rating & 60% to Execution Average Rating, second departmentgives 30% & 70% and third department gives 80% & 20%. Final Weighted Rating of all employees is shown in Fig.D
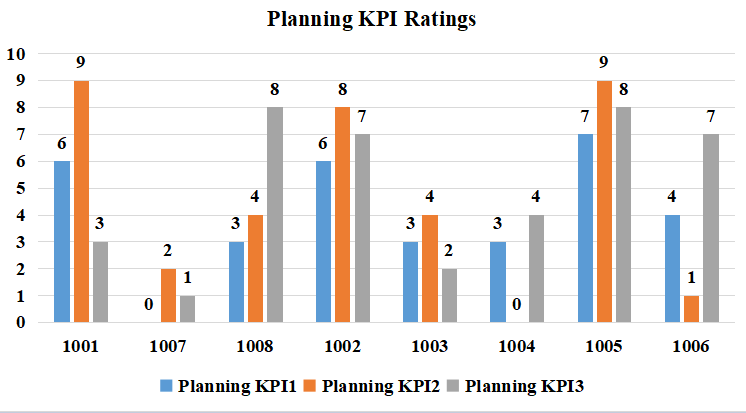
Figure A
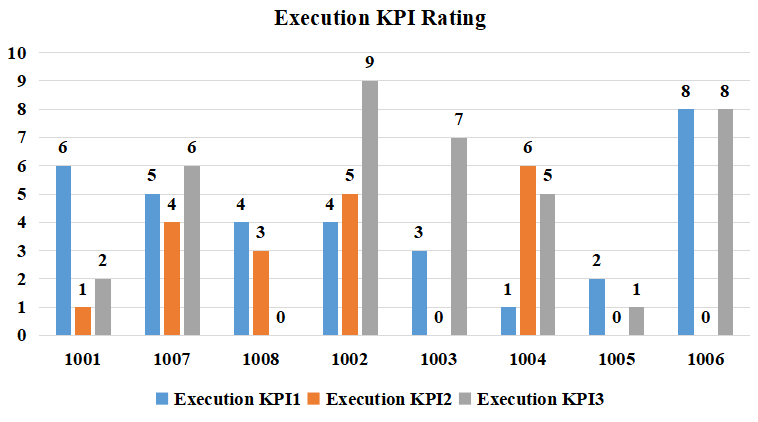
Figure B
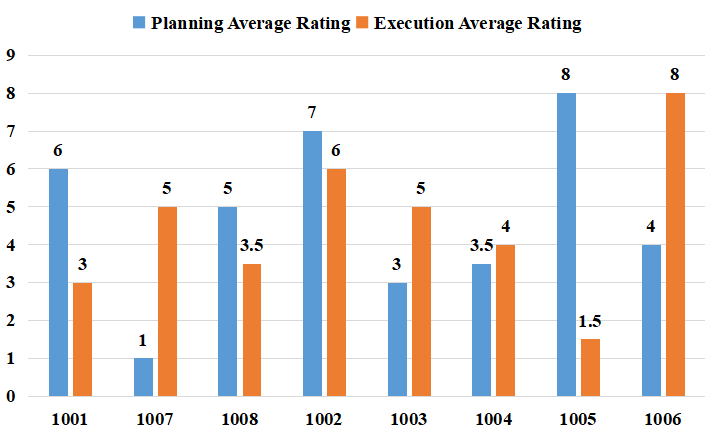
Figure C
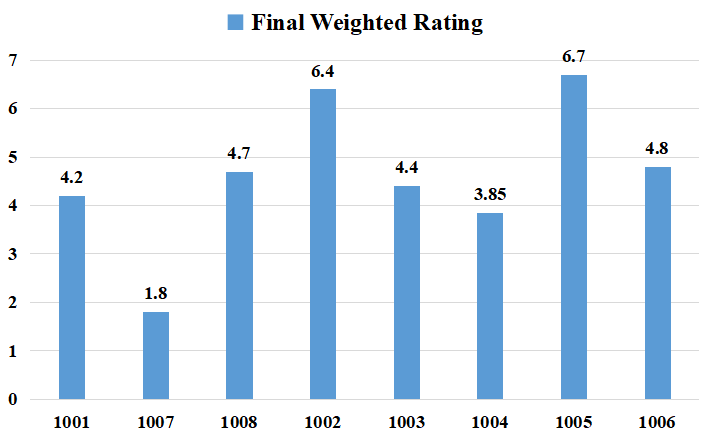
Figure D
Question 13: Who among the following are working in same department?
a) 1001 and 1007
b) 1002 and 1008
c) 1006 and 1008
d) 1004 and 1005
13) Answer (C)
Solution:
From the final weighted rating , planning average rating and execution average rating we can calculate the departments to which they belong on the basis of weightage distribution.
Employee 1001 has a planning average rating of 9 and execution average rating of 3 and final rating is 4.2
Using weighted average method we can say than 20% weightage is given to planning and 80% weightage is given to execution average rating.
Similarly for other employees also we can calculate this
Employees in department which gives 40% weight to planning 60% weightage to execution are 1001, 1002
Employees in department which gives 30% weight to planning 70% weightage to execution are 1003, 1004
Employees in department which gives 20% weight to planning 80% weightage to execution are 1007, 1008, 1005, 1006
Question 14: How many employees are managing all the six process (three processes of Planning and threeprocesses of Execution)? Hence, they have been rated for all six process KPIs.
a) 2
b) 3
c) 4
d) 5
14) Answer (A)
Solution:
From charts we can see that only employee 1001 and 1002 have been rated in all the six KPIs.
Question 15: Who among the following employees is working in Department C?
a) 1001
b) 1003
c) 1004
d) 1005
15) Answer (D)
Solution:
From the final weighted rating , planning average rating and execution average rating we can calculate the departments to which they belong on the basis of weightage distribution.
Employee 1001 has a planning average rating of 9 and execution average rating of 3 and final rating is 4.2
Using weighted average method we can say than 20% weightage is given to planning and 80% weightage is given to execution average rating.
Similarly for other employees also we can calculate this
Employees in department which gives 40% weight to planning 60% weightage to execution are 1001, 1002
Employees in department which gives 30% weight to planning 70% weightage to execution are 1003, 1004
Employees in department which gives 20% weight to planning 80% weightage to execution are 1007, 1008, 1005, 1006
Department C has maximum employees so 1005, 1006, 1007, 1008 belong to department C.
Question 16: How many employees have got zero rating in any of their six KPI Ratings?
a) 1
b) 3
c) 4
d) 6
16) Answer (D)
Solution:
We can count from the tables given that a total 6 employees have got a ration of 0 in atleast one of the KPI rating.


