
Line Graph Questions for CMAT 2022 – Download PDF
Here you can download CMAT 2022 – important Line Graph Questions PDF by Cracku. Very Important Line Graph Questions for CMAT 2022 based on asked questions in previous exam papers. These questions will help your CMAT preparation. So kindly download the PDF for reference and do more practice.
Download Line Graph Questions for CMAT
Take CMAT mock tests here
Download CMAT previous papers PDF
Instructions
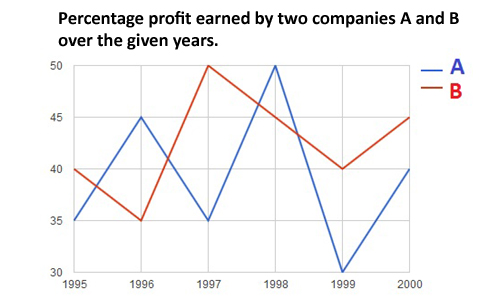
Direction: The graph below gives the percentage rise in profits of two companies over the years. Study the graph carefully to answer the questions that follow.
<img “=”” alt=”” class=”img-responsive” src=”https://cracku.in/media/questionGroup/DI_4.jpg “/>
Question 1: If the profit earned by Company L in the year 2005 was Rs. 1.84 lakhs, what was the profit earned by the company in the year 2006 ?
a) Rs. 2.12 lakhs
b) Rs. 2.3 lakhs
c) Rs. 2.04 lakhs
d) Cannot be determined
e) None of these
Question 2: If the profit earned by Company M in the year 2008 was Rs. 3.63 lakhs, what was he amount of profit earned by it in the year 2006 ?
a) Rs. 2.16 lakhs
b) Rs.1.98 lakhs
c) Rs. 2.42 lakhs
d) Cannot be determined
e) None of these
Question 3: What is the average percent rise in profit of Company L over all the years together?
a) 15.33
b) 25.33
c) 18.83
d) 25.83
e) None of these
Question 4: Which of the following statements is TRUE with respect to the above graph ?
a) Company M made the highest profit in the year 2009
b) Company L made least profit in the year 2005
c) The respective ratio between the profits earned by Company L and M In the year 2006 was 6:5
d) Company L made the highest profit in the year 2008
e) All are true
Question 5: What is the percentage increase in percent rise in profit of Company M in the year 2009 from the previour year ?
a) 25
b) 15
c) 50
d) 75
e) None of these
Get 5 CMAT mocks at just Rs.299
Instructions
Direction: Study the given graph carefully to answer the questions that follow:
Number of days taken by three carpenters to finish making one piece each of four different items of furniture
<img “=”” alt=”” class=”img-responsive” src=”https://cracku.in/media/questionGroup/DI_5.jpg “/>
Question 6: If Carpenter X and Carpenter Y were to make a chair together how many days would they take?
a) 1 day
b) 4 days
c) 3 days
d) 2 days
e) None of these
Question 7: If Carpenters X, Y and Z were to make a table together how many days would they take ?
a) 4 days
b) 3 days
c) 1 day
d) 2 days
e) None of these
Question 8: What is the total number of days that Carpenter Z will take to make one piece each of all the four items together ?
a) 32 days
b) 24 days
c) 26 days
d) 28 days
e) None of these
Instructions
Direction: Study the given graph carefully to answer the questions that follow
Number of days taken by three carpenters to finish making one piece each of four different items of furniture
<img “=”” alt=”” class=”img-responsive” src=”https://cracku.in/media/questionGroup/DI_5_1.jpg “/>
Question 9: If Carpenters X, Y and Z were to make a table together how many days would they take ?
a) 4 days
b) 3 days
c) 1 day
d) 2 days
e) None of these
Instructions
Study the following graph carefully and answer the questions given below it.
Percentage Profit/Loss = $\frac{Income – Expenditure}{Expenditure}\times100$
Question 10: If the income of company B in 1997 and 1998 were in the ratio of 2 : 3, what was the ratio of the expenditure of the company in these two years ?
a) 20 : 29
b) 9 : 10
c) 29 : 45
d) 10 : 29
e) None of these
Download CMAT Previous Papers PDF
Instructions
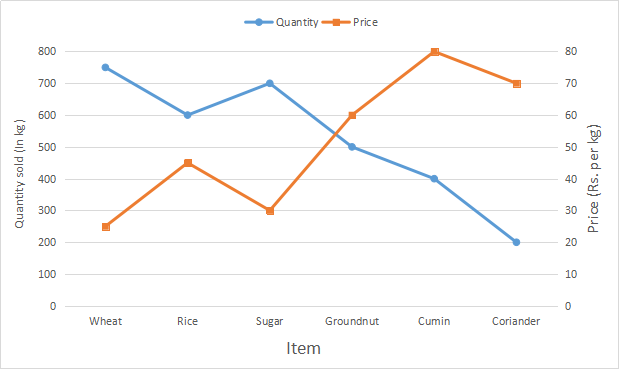
Study the following graph carefully to answer these questions.
Quantity of Various Items Sold and Price Per kg.
Question 11: If the quantity of corriander sold is increased by 200% and the price per kg. is reduced by 8%, what will be the total cost of corriander sold ?
a) Rs. 38,460
b) Rs. 36,480
c) Rs. 38,640
d) Rs. 36,840
e) None of these
Question 12: If the quantities sold of Groundnut and Cumin are interchanged, what will be the total cost of quantities sold for these two items together ?
a) Rs. 62,000
b) Rs. 60,000
c) Rs.65,000
d) Rs. 63,000
e) None of these
Question 13: Out of the total quantity of sugar sold, half the quantity is sold at the given rate while half the quantity is sold on a price increased by 20%. What is the total cost of entire quantity of sugar sold ?
a) Rs. 23,100
b) Rs. 23,800
c) Rs. 22,400
d) Rs. 23,400
e) None of these
Question 14: If cumin is sold at a 10% discount, the quantity sold doubles. What will be the cost of total quantity of cumin sold on discount ?
a) Rs. 52,600
b) Rs.28,800
c) Rs.32,000
d) Rs.57,600
e) None of these
Question 15: what is the average price per kg. of wheat and rice sold ? (rounded off to nearest integer)
a) 32
b) 34
c) 36
d) 35
e) 31
Answers & Solutions:
1) Answer (B)
Profit in 2006 = 1.84 * 125/100 = 1.84*5/4 = 0.46*5 = 2.3 lakh
2) Answer (C)
Let the profit in 2006 be x.
Profit in 2007 = 5x/4
Profit in 2008 = 6/5 * 5x/4 = 3x/2 = 3.63 lakh
=> x = 1.21*2 = 2.42 lakh
3) Answer (E)
The average percentage rise in profits over all the years for company L is average of the 6 years values ie. sum of each years value divided by 6 = 150/6 = 25%.
4) Answer (A)
The graphs show the percentage rise in profits. So, the profits for the two companies are increasing from 2004 to 2009. So, the highest profit by both the companies is made in 2009 and the least profit in 2004.
Consider statement A: M made the highest profit in 2009. This statement is true.
Consider statement B: L made the least profit in 2005. This statement is false.
So, the answer is option a) (Since option e) is not true anymore).
5) Answer (C)
Percent rise in profit of company M in 2008 = 20%
Percent rise in profit of company M in 2009 = 30%
Percentage increase = (30-20)/20 * 100 = 50%
6) Answer (E)
Number of days required = 1/(1/2+1/3) = 1/(5/6) = 6/5 days.
So, option e).
7) Answer (C)
Individually, they take 2, 3 and 6 days respectively to make the table.
So, their combined one day work = 1/2 + 1/3 + 1/6 = 1
So, the three of them can finish making a table in 1 day.
8) Answer (D)
Chair = 4 days
Table = 6 days
Bed = 10 days
Cupboard = 8 days
Total number of days needed = 28 days
9) Answer (C)
Individually, they take 2, 3 and 6 days respectively to make the table.
So, their combined one day work = 1/2 + 1/3 + 1/6 = 1
So, the three of them can finish making a table in 1 day.
10) Answer (C)
Percentage profit = 100* (Income – Expenditure)/Expenditure
So, Income = E * (%P+1)
E = Income / (%P +1)
Thus, the required ratio is 2 * (100/150) : 3 * (100/145) = 29 : 45
11) Answer (C)
Original quantity of coriander sold = 200 kg
New quantity if it is increased by 200 % = $200 + \frac{200}{100} \times 200 = 600$ kg
Original price per kg = Rs. 70
New price if it is reduced by 8 % = $70 – \frac{8}{100} \times 70 = $Rs. $64.40$
$\therefore$ Total cost of coriander sold = $600 \times 64.40$
= Rs. $38,640$
12) Answer (E)
Quantity sold for groundnut and cumin are respectively 500 kg and 400 kg
After interchanging, quantity sold for groundnut = 400 kg
and quantity sold for cumin = 500 kg
Also, price per kg for groundnut = Rs. 60
and price per kg for cumin = Rs. 80
$\therefore$ Total cost of quantities sold for these two items together
= Rs. $(400 \times 60 + 500 \times 80)$
= Rs. $(24,000 + 40,000)$
= Rs. $64,000$
13) Answer (A)
Total quantity of sugar sold = 700 kg and price per kg = Rs. 30
Acc to ques, 350 kg is sold at Rs. 30 per kg
Another 350 kg is sold at = $30 + \frac{20}{100} \times 30$ = Rs. $36$
$\therefore$ Total cost of entire quantity of sugar sold
= Rs. $(350 \times 30 + 350 \times 36)$
= Rs. $(350 \times 66)$
= Rs. $23,100$
14) Answer (D)
Total quantity of cumin sold = 400 kg and price per kg = Rs. 80
Now, after 10 % discount, price = $80 – \frac{10}{100} \times 80$ = Rs. $72$
New quantity sold for cumin = $2 \times 400 = 800$ kg
$\therefore$ Total quantity of cumin sold on discount
= Rs. $(800 \times 72)$
= Rs. $57,600$
15) Answer (B)
For wheat :
Total quantity sold = 750 kg and price per kg = Rs. 25
=> Total cost = 750 * 25 = Rs. 18,750
For rice :
Total quantity sold = 600 kg and price per kg = Rs. 45
=> Total cost = 600 * 45 = Rs. 27,000
$\therefore$ Average price per kg. of wheat and rice sold
= $\frac{18750 + 27000}{750 + 600}$
= $\frac{45750}{1350} = 33.89 \approx 34$


