
IIFT Data Structure Questions PDF [Most Important]
Practice IIFT solved Data Structure Questions paper tests, which are the practice question to have a firm grasp on the Data Structure topic in the IIFT exam. In this article, one can find the top 20 very Important Data Structure Questions for IIFT based on asked questions in previous exam papers. The IIFT question papers contain actual questions asked with detailed solutions. Download these important Data Structure Questions for IIFT PDF with detailed solutions. Click on the link given below to download the PDF.
Download Data Structure Questions for IIFT
Get IIFT 2023 Mocks at Just Rs. 299
Question 1: Study the following graph and answer the question that follows.
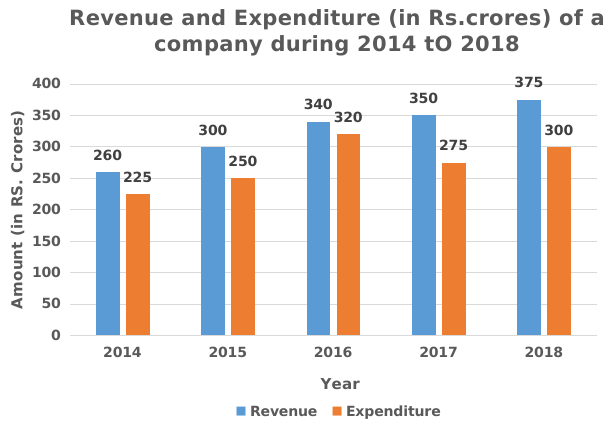
What is the total ratio of the revenue of the company in 2016 and 2018 to that of the total expenditure in 2015 and 2017 respectively?
a) 143:105
b) 130:103
c) 115:114
d) 105:143
1) Answer (A)
Solution:
Total revenue of the company in 2016 and 2018 = 340 + 375 = 715
Total expenditure of the company in 2015 and 2017 = 250 + 275 = 525
Required Ratio = 715 : 525
i.e; 143 : 105
Hence, option A is correct.
Question 2: Study the following graph and answer question that follows.

The expenditure of the company in 2016 is what percentage more then the average revenue (per year) in 2014, 2015 and 2018 (correct to the nearest integer)?
a) 3%
b) 5%
c) 6%
d) 4%
2) Answer (A)
Solution:
Expenditure of the company in 2016 = 320
Average revenue in 2014,2015 and 2018
$\therefore\frac{\left(revenue\ in\ 2014+revenue\ in\ 2015+revenue\ in\ 2018\right)}{3}$
$\therefore\frac{\left(260+300+375\right)}{3}$
= 311.67
Required percentage = $\frac{\left(320-311.67\right)}{311.67}$
$=2.67\simeq\ 3\%$
Hence, option A is correct
Question 3: In the table, the production and the sale (in 1000 tonnes) of a certain product of a company over5 years is given.
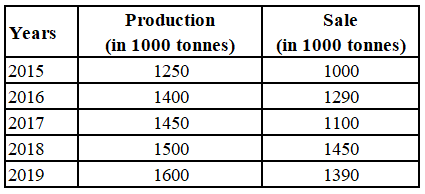
In which year(s) the production increases by more than 10% of that in the previous year?
a) 2018, 2019
b) 2017, 2018
c) 2019
d) 2016
3) Answer (D)
Solution:
Percentage increase in production of 2016 compared to 2015 = $\frac{150}{1250}\times$100 = 12%
Percentage increase in production of 2017 compared to 2016 = $\frac{50}{1400}\times$100 = 3.57%
Percentage increase in production of 2018 compared to 2017 = $\frac{50}{1450}\times$100 = 3.44%
Percentage increase in production of 2019 compared to 2018 = $\frac{100}{1500}\times$100 = 6.67%
$\therefore$ Only in 2016, the production increases by more than 10% of that in the previous year.
Hence, the correct answer is Option D
Question 4: Table shows District-wise data of number of primary school teachers posted in schools of a city.
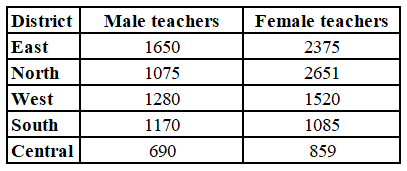
What is the difference between the total number of male teachers in the districts East, North, West taken together and the total number of female teachers in the districts East and South?
a) 735
b) 771
c) 110
d) 545
4) Answer (D)
Solution:
The total number of male teachers in the districts East, North, West taken together = 1650 + 1075 + 1280
= 4005
The total number of female teachers in the districts East and South = 2375 + 1085
= 3460
Required difference = 4005 – 3460
= 545
Hence, the correct answer is Option D
Question 5: Table shows the number of trees planted in 4 cities from 2016 to 2020.

In which city were maximum trees planted in 2016 and 2019 taken together?
a) Chandigarh
b) Ahmedabad
c) Pune
d) Kolkata
5) Answer (B)
Solution:
Trees planted in Chandigarh in 2016 and 2019 together = 1800 + 2440 = 4240
Trees planted in Ahmedabad in 2016 and 2019 together = 2500 + 1950 = 4450
Trees planted in Pune in 2016 and 2019 together = 1800 + 1900 = 3700
Trees planted in Kolkata in 2016 and 2019 together = 2000 + 1600 = 3600
$\therefore$ In Ahmedabad, maximum trees planted in 2016 and 2019 taken together
Hence, the correct answer is Option B
Question 6: Study the following table and answer the question:
Percentage of marks obtained by six students in five subjects A, B, C, D & E.
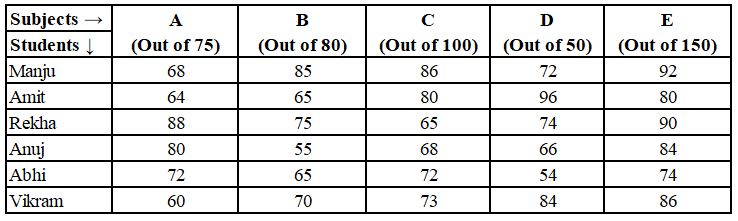
The average marks of Manju, Rekha and Abhi in subject B are?
a) 54
b) 60
c) 56
d) 62
6) Answer (B)
Solution:
Marks obtained by Majnu in subject B = $\frac{85}{100}\times$80 = 68
Marks obtained by Rekha in subject B = $\frac{75}{100}\times$80 = 60
Marks obtained by Abhi in subject B = $\frac{65}{100}\times$80 = 52
The average marks of Manju, Rekha and Abhi in subject B = $\frac{68+60+52}{3}$
= $\frac{180}{3}$
= 60
Hence, the correct answer is Option B
Question 7: The bar graph given below shows the sales of Newspapers (in lakh number) from six branches of a Media Publication Company during two consecutive years 2017 and 2018.
(Note: The data shown below is only for mathematical exercise. They do not represent the actual figures).
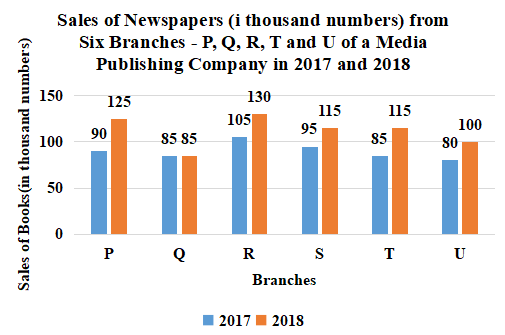
Total Sales of U for both the years is what percent (correct to one place of decimal) of the combined Sales of the branches Q and R for 2017 and 2018?
a) 48.6%
b) 67.1%
c) 44.4%
d) 41.0%
7) Answer (C)
Solution:
Total Sales of U for both the years = 80 + 100
= 180
Total sales of Q for 2017 and 2018 = 85 + 85
= 170
Total sales of R for 2017 and 2018 = 105 + 130
= 235
The combined Sales of the branches Q and R for 2017 and 2018 = 170 + 235
= 405
Required percentage = $\frac{180}{405}\times$100
= 44.4%
Hence, the correct answer is Option C
Question 8: The pie graph shows the distribution of employees working in five departments A, B, C, D and E of a company.
Total number of employees = 9000
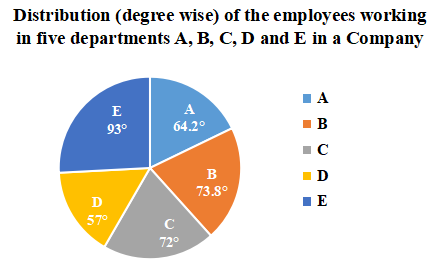
If the number of employees working in department A is x and the total number of employees working in departments C and E is y, then the value of y – 2x is:
a) 725
b) 850
c) 1000
d) 915
8) Answer (D)
Solution:
Number of employees working in department A = x = $\frac{64.2^{\circ\ }}{360^{\circ\ }}\times9000$ = 1605
x = 1605
Number of employees working in department C = $\frac{72^{\circ\ }}{360^{\circ\ }}\times9000$ = 1800
Number of employees working in department E = $\frac{93^{\circ\ }}{360^{\circ\ }}\times9000$ = 2325
The total number of employees working in departments C and E = y = 1800 + 2325 = 4125
y = 4125
y – 2x = 4125 – 2(1605) = 4125 – 3210 = 915
Hence, the correct answer is Option D
Question 9: Bar graph shows the number of males and females in five organizations A, B, C, D and E.
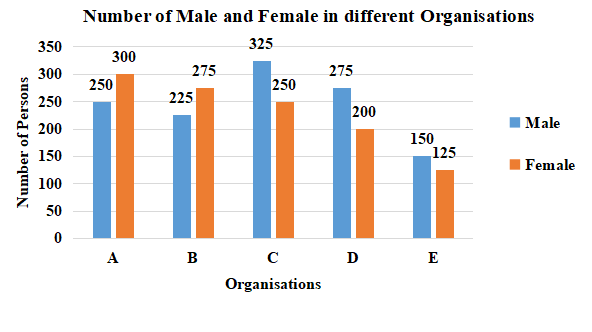
What is the ratio of number of males working in organizations C, D and E taken together to that of females working in organizations A, B and C taken together?
a) 10:11
b) 49:46
c) 11:10
d) 46:49
9) Answer (A)
Solution:
Number of males working in organizations C, D and E taken together = 325 + 275 + 150 = 750
Number of females working in organizations A, B and C taken together = 300 + 275 + 250 = 825
Required ratio = 750 : 825
= 10 : 11
Hence, the correct answer is Option A
Question 10: The data given in the table shows the number of boys and girls enrolled in three different streams in a school over 5 years.
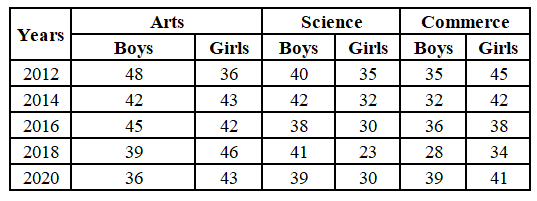
What is the ratio of the total number of boys in the year 2014 to the total number of girls in the year 2020?
a) 58 : 57
b) 55 : 57
c) 58 : 53
d) 1 : 1
10) Answer (A)
Solution:
Ratio of the total number of boys in the year 2014 to the total number of girls in the year 2020 = (42+42+32) : (43+30+41)
= 116 : 114
= 58 : 57
Hence, the correct answer is Option A
Question 11: Table shows income (in ₹) received by 4 employees of a company during the month of December 2020 and all their income sources.
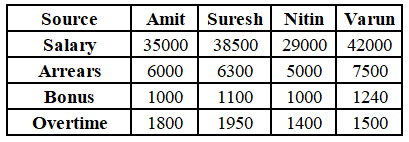
What is the ratio of salary of Varun to his income other than salary?
a) 128 : 653
b) 653 : 128
c) 128 : 525
d) 525 : 128
11) Answer (D)
Solution:
The ratio of salary of Varun to his income other than salary = 42000 : (7500+1240+1500)
= 42000 : 10240
= 525 : 128
Hence, the correct answer is Option D
Question 12: Table shows the number of trees planted in 4 cities from 2016 to 2020.
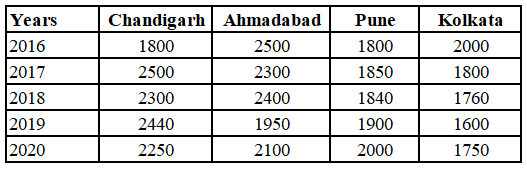
What is the total number of trees planted in Chandigarh in 2017 and in Kolkata in 2020?
a) 4500
b) 4750
c) 4250
d) 3550
12) Answer (C)
Solution:
From the table,
Number of trees planted in Chandigarh in 2017 = 2500
Number of trees planted in Kolkata in 2020 = 1750
The total number of trees planted in Chandigarh in 2017 and in Kolkata in 2020 = 2500 + 1750
= 4250
Hence, the correct answer is Option C
Question 13: Study the following table and answer the question:
Number of students Appeared (A) and Passed (P) in an annual examination from four schools Q, R, S & T in five years (2014 to 2018)

The difference between the average number of students passed from school R in 2015 to 2017 and the number of students passed from school Q in 2015 is x. The value of x lies between:
a) 20 and 25
b) 35 and 40
c) 30 and 35
d) 25 and 30
13) Answer (C)
Solution:
The difference between the average number of students passed from school R in 2015 to 2017 and the number of students passed from school Q in 2015 is x.
x = 320 – ($\frac{285+294}{2}$)
x = 320 – 289.5
x = 30.5
x lies between 30 and 35.
Hence, the correct answer is Option C
Question 14: Study the following table and answer the question:
Number of students Appeared (A) and Passed (P) in an annual examination from four schools Q, R, S & T in five years (2014 to 2018)
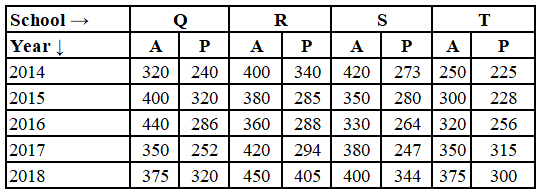
The total number of students passed from school S in 2014 and 2017 is what percent of 90% of the total number of students appeared from school T in 2015, 2016 and 2017? (correct to one decimal place)
a) 53.9
b) 54.8
c) 59.6
d) 57.4
14) Answer (C)
Solution:
The total number of students passed from school S in 2014 and 2017 = 273 + 247 = 520
90% of the total number of students appeared from school T in 2015, 2016 and 2017 = $\frac{90}{100}\left(300+320+350\right)$
= 873
Required percentage = $\frac{520}{873}\times100$
= 59.6(approximately)
Hence, the correct answer is Option C
Question 15: The following bar graph shows the amount(in Lakh Rs.) invested by a Company in purchasing raw material over the years and the values (in Lakh Rs.) of finished goods sold by the Company over the years.
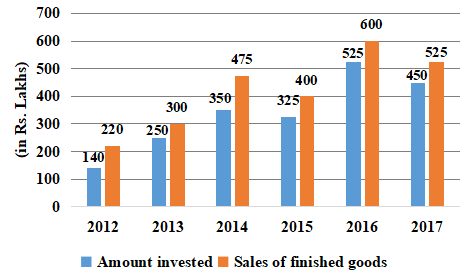
The ratio of total amount invested for purchasing raw material from 2013 to 2015 to the total sales of finished goods in 2014, 2016 and 2017 is:
a) 27 : 56
b) 56 : 27
c) 64 : 37
d) 37 : 64
15) Answer (D)
Solution:
Total amount invested for purchasing raw material from 2013 to 2015 = 250 + 350 + 325 = 925
The total sales of finished goods in 2014, 2016 and 2017 = 475 + 600 + 525 = 1600
Required ratio = 925 : 1600
= 37 : 64
Hence, the correct answer is Option D
Instructions
Study the following table and answer the question:
Number of students enrolled for Vocational Courses (VC) in five institutes – A, B, C, D & E.

Question 16: The total number of students enrolled for VC in institutes A, B and D in 2015 is what percent more than the total number of students enrolled in institutes C and E in 2018? (correct to one decimal point)
a) 28.2
b) 36.8
c) 35.7
d) 39.3
16) Answer (D)
Solution:
Total number of students enrolled for VC in institutes A, B and D in 2015 = 130 + 138 + 122
= 390
Total number of students enrolled for VC in institutes C and E in 2018 = 135 + 145
= 280
Required percentage = $\frac{390-280}{280}\times$100
= $\frac{110}{280}\times$100
= 39.3% (approximately)
Hence, the correct answer is Option D
Question 17: What is the sum of the average number of students enrolled for VC in institute B in 2014, 2015 and 2017 and the average number of students enrolled in institute E in 2013 and 2018?
a) 250
b) 265
c) 260
d) 255
17) Answer (C)
Solution:
Average number of students enrolled for VC in institute B in 2014, 2015 and 2017 = $\frac{132+138+135}{3}$
= $\frac{405}{3}$
= 135
Average number of students enrolled in institute E in 2013 and 2018 = $\frac{105+145}{2}$
= $\frac{250}{2}$
= 125
Required sum = 135 + 125
= 260
Hence, the correct answer is Option C
Question 18: The given histogram represents the marks obtained by 128 students. Read the graph and answer the question that follows.
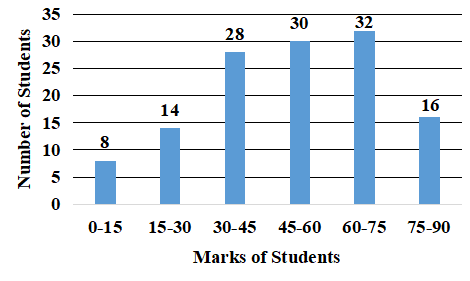
What percent of students got marks less than 60?
a) 67.5%
b) 72.5%
c) 75%
d) 62.5%
18) Answer (D)
Solution:
From the Histogram,
Number of students who got less than 60 marks = 8 + 14 + 28 + 30
= 80
Required percentage = $\frac{80}{128}\times$100
= 62.5%
Hence, the correct answer is Option D
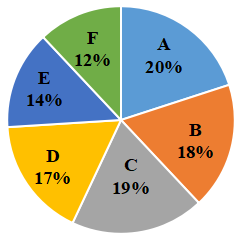
Question 19: The following Pie chart represents the percentage-wise distribution of 800 students of class XII in a school in six different sections A, B, C, D, E and F.
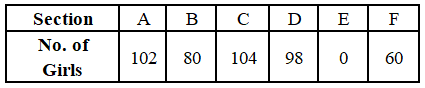
The table given below shows the number of girls of class XII in six different sections A, B, C, D, E and F.
The total number of girls in sections B, C and D together is what percent more than the total number of boys in sections A, B and D together?
a) 50
b) 76.25
c) 65.75
d) 80
19) Answer (B)
Solution:
Number of students in section A = $\frac{20}{100}\times$800 = 160
Number of boys in section A = 160 – 102 = 58
Number of students in section B = $\frac{18}{100}\times$800 = 144
Number of boys in section B = 144 – 80 = 64
Number of students in section D = $\frac{17}{100}\times$800 = 136
Number of boys in section D = 136 – 98 = 38
Total number of boys in sections A, B and D together = 58 + 64 + 38 = 160
Total number of girls in sections B, C and D together = 80 + 104 + 98 = 282
Required percentage = $\frac{282-160}{160}\times$100
= $\frac{122}{160}\times$100
= 76.25%
Hence, the correct answer is Option B
Question 20: Study the following table and answer the question:
Number of students enrolled for Vocational Courses (VC) in institutes A, B, C, D, E & F.
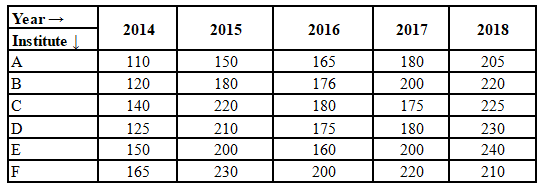
The total number of students enrolled for VC in institutes D and F in 2014 is what percent of the total number of students enrolled in institutes A, B and C in 2018? (correct to one decimal point)
a) 43.2
b) 42.8
c) 43.8
d) 44.6
20) Answer (D)
Solution:
The total number of students enrolled for VC in institutes D and F in 2014 = 125 +165 = 290
The total number of students enrolled for VC in institutes A, B and C in 2018 = 205 + 220 + 225 = 650
Required percentage = $\frac{290}{650}\times$100
= 44.61(approximately)
Hence, the correct answer is Option D


