
Data Interpretation is one of the most important topics in SBI PO exam. Thus, if you want to crack this exam, you should prepare Data Interpretation for SBI PO very well. This topic covers around 25% of the paper in the mains exam. It has a considerable weightage in prelims also. Hence any serious candidate should not take this topic lightly. Read about Data Interpretation for IBPS PO 2017.
Data Interpretation for SBI PO is not a difficult topic to master. The only thing you need is to be quick with calculations. Data Interpretation questions in SBI PO are calculation intensive. So if you are not quick with the calculations, you might not be able to solve all questions. The only thing which can help you develop speed is practice. Answering all Data Interpretation questions from SBI PO Previous Year Question Papers will help you familiarize with the DI section.
As the SBI PO notification for 2017 is out. Many of you might have already applied for the exam. It is one of the most sought after government jobs. In this blog, we will discuss about some common variants in which data is usually presented in the SBI PO exam. Familiarizing yourself with the question types now will save you important time when you are attempting the exam.
DATA INTERPRETATION FOR SBI PO: Question types
1. TABLES
The first and most common form in which data is presented is the tabular form.
The data will be given to you in the form of a table and you will just have to do simple calculations to arrive at the answer. The important thing is to be careful while reading the data. Let’s have a look at an example to understand how data is presented in tabular form:
The following table consists of the number of students in 5 different schools in Hyderabad over the last 5 years

Now you may be asked a question like
Which school had the highest percentage increase in the number of enrolled students in 2013 over 2012?
Now you have to calculate the percentage increase for each of the schools. This is where you need to be very careful. You should observe the data carefully and should not make a mistake while calculating.
Let’s have a look at another question type which is important in Data Interpretation for SBI PO exam
2. Bar Graphs
In these questions, the data will be presented to you in the form of bar graph. So here you need to carefully observe the graph to infer the information correctly. An error in observation can easily lead to a wrong answer.
Let’s have a look at an example to understand these type of questions
The following bar graph shows the strengths of 3 schools for 5 different years.
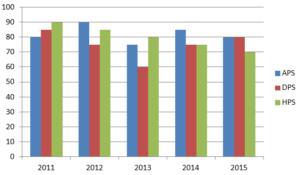
Now from the graph, you can infer that blue bar corresponds to APS, red corresponds to DPS and green correspond to HPS. Such guidelines for interpreting the data will always be given in the graph. So if we want to know the number of students in DPS in 2015, we will have to look at the red bar in 2015. This would give us the required value as 80. Similarly, we can get values for any school for any of the given years.
Another important question type in Data Interpretation for SBI PO exam is Pie Chart.
| Take a free Mock for IBPS PO (in the latest pattern) |
3. PIE CHARTS
Pie chart is another common question type which often appears in data interpretation section of most banking exams. A pie chart can be given to you in which the shares of various components are given in percentages or in some cases, they may be given in degrees. You should pay attention to this aspect while reading the pie chart. Let’s have a look at the examples for both the types
Type 1: When the share of different components is given in percentage.
The following pie chart contains the share of various companies in the automobile sales for 2014. The total sales in 2014 were 1000000 units.

So from this, we can infer the actual share of various companies in the total sales.
From the graph, it is evident that Red corresponds to Maruti, green corresponds to Honda and so on. So if we have to find the total sales of Honda, we simply need to look at its share and then multiply it by total sales. For example, in this case, Honda’s share is 15%. Total sales = 1000000 units (given).
Hence Honda’s share would be 15*1000000/100 = 150000.
This is a very easy form to interpret, you just need to be careful while calculating and observing.
Type 2: When the shares of different components is given in degrees
This form of representation is slightly more tricky when it comes to representation of data in pie chart form. For example, consider the following example
The pie chart below gives the average time (in a day) spent in various activities by a 5th-grade student.

Now we know that a complete circle corresponds to 360 degrees. So if the share of sleeping is 90°, then it means that its actual share would be (90/360) = ¼
To find how many hours are spent sleeping we can simply do 24/4 = 6. It is slightly tricky when the data is given in degrees. This is evident from the above example.Hence, you need to be extra cautious in these cases. A slight mistake in observation or calculation can result in negative marks.
Let’s have a look at another form in which the data is presented. This is also an important type as far as the data interpretation for SBI PO is concerned.
4. LINE CHARTS
Line chart is another common format which appears in the exam. Each line will represent a different thing. Let’s have a look at an example to understand it better.
The following line chart shows the runs scored by 4 different batsmen over the last 5 years.
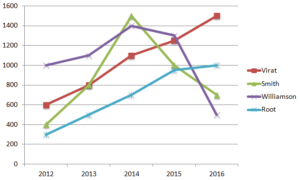
So from the figure, we can infer that red line corresponds to Virat, green corresponds to Smith, purple corresponds to Williamson and blue corresponds to Root. The x-axis represents the year and y-axis represents the runs. There are markers in the graph to identify the values correctly. Sometimes, the markers may be absent. In that case, you need to be extra cautious while observing the data.
CONCLUSION
Thus, from our above discussion, it is evident that questions on data interpretation for SBI PO are not difficult. Familiarity with the formats in which data is presented is the exam will be helpful. Quick calculation skills are very important. Practice will help you improve on these aspects. You can practice from our free mocks for SBI PO prelims and mains exam. Our mocks are closest to actual exams. It will not only help you in your preparations for SBI PO exam but it will also give you a good idea of your performance with respect to your competitors.
We have several other blogs which can be very helpful in your preparation. Links for these blog posts are given below. All the best for your exam.
Number systems for SBI PO


Nice materials provided here in cracku…Will u b providing for Isro assistant and UDC exam which is going to b held on Oct 15