
IBPS PO is among the most competitive exams in the country. The number of people taking this exam is increasing every year. This is probably one of the main reasons due to which the cut-offs for IBPS PO have been constantly increasing in the recent past. You can get the idea of the difficulty level of the exam by going through the previous year papers of IBPS PO. In this post, we will discuss data interpretation for IBPS PO exam.
DATA INTERPRETATION FOR IBPS PO
Data interpretation is a very important topic for all banking exams and IBPS is no exception to it. There are 10 questions from this topic in the prelims exam and 20 questions in the mains exam. Hence, any serious aspirant should not ignore this topic.
In order to well in the data interpretation for IBPS PO, one should be quick with calculations. Mostly DI sets in banking exams are very calculation intensive. So a good calculation speed will surely save you precious time. Hence, try to develop good calculation speed.
Let us now discuss some common types of DI sets for IBPS Po exam.
TABLES
This is one of the most common types of DI sets in all banking exams. At times, the given table will be completely filled and all questions will involve extensive calculation. An example of such a table is given below
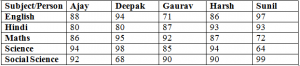
The questions in such a table will simply involve some calculations. To solve quickly, learn important maths tricks for IBPS PO exam. These are the easiest type of questions on data interpretation for IBPS PO.
Cumulative table based DI are also very common. For example, consider the table given below. We are the average scores of 5 different students at the end of different years. We also know that the maximum marks are 1500 for each year.
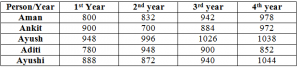
Now sets like these are slightly more logical and require extensive calculations.
For example, Aman’s marks in the second year will be 832*2 – 800 = 864.
Similarly, marks obtained by Aman in the third year will be 942*3 – 832*2 = 1162.
Hence, we will need to make a lot of calculations to determine the marks of each student in each year.
Another variant of table based DI sets is the one where some of the values in the table are missing. The following table is an example missing table set.
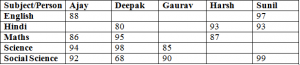
We are given some conditions to determine the unknown values. These require calculations but are more logical in nature. Hence, one should try to these at the end if one is not comfortable with such sets. Practice will certainly help you in cracking such sets quickly. You can find free practice sets of data interpretation questions on our website.
BAR GRAPHS
In these questions, the data is represented using bar graphs. These are fairly straight forward sets. One should observe the values closely as a slight mistake can lead to missing out on easy marks. Let us consider an example to understand this better.
The following bar graph gives the number of matches won by 4 different captains in different formats of cricket.
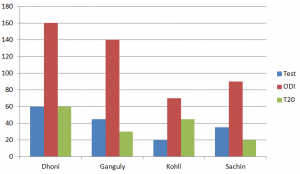
These are among the easiest type of bar graphs. The questions on these kinds of sets can mostly be solved using observation. You are given colour codes to identify which bar represents what. You should observe the graphs carefully before answering the questions.
Stacked graph is also a common type in DI. An example of stacked bar graph is shown below
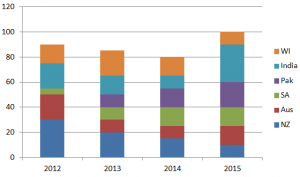
Here instead of giving separate bars for each team, they are given in a stacked format. The addition data in each question makes these slightly more difficult. But still these are a lot less time consuming then cumulative tables and missing tables. Hence one should prefer these over missing tables and cumulative tables.
Let us now have a look at another common variant of DI sets. This is pie charts.
| Take a free Mock for IBPS PO (in the latest pattern) |
PIE CHARTS
Pie chart is another one of the common types of data interpretation questions in banking exams. In a pie chart, the shares of various components are generally given in percentages. In some cases, shares are given in degrees. Hence, be careful about the format of the pie chart.
Let’s have a look at one pie chart to understand it better.
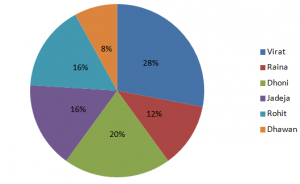
The pie chart gives the share of the runs scored by 6 different players over the past 1 year. We know that these players scored 80 percent of the total runs scored by the Indian team. We know that the total runs scored by the Indian team in the last one year were 8000.
Now we can easily calculate the runs scored by any player. For example, the runs scored by Raina will be 8000*.8*.12 = 768. Hence, we can see that these are fairly easy questions. Sometimes questions consist of multiple pie charts. This makes it slightly more difficult but the pie chart questions can still be solved with ease.
In some cases, the shares are given in degrees. For those cases, we just need to know that the angle in a complete circle is 360°. Hence someone having a share of 60° will have 1/6 share in the total value.
Learn about how to crack Quantitative aptitude section of IBPS PO exam. Let us now discuss another common type in data interpretation for IBPS PO.
LINE CHARTS
In line charts, different lines represent different things. Let us consider an example to understand them better.
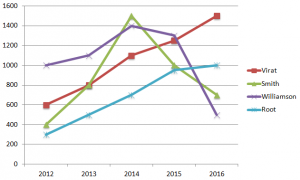
This line chart gives a comparison of the runs scored by 4 different players over the last 4 years. The graph has the codes to decode the lines corresponding to different players. In these kinds of questions, you need to be cautious while reading the data. Other than that, the questions essentially involve simple calculations. Hence, good calculation speeds will be extremely helpful.
CONCLUSION
Thus, we have covered the most common formats of data interpretation for IBPS PO exam. We discussed some basic concepts about reading these graphs. You can try and solve some questions based on these type of sets. Solving questions will improve your speed. You can find good quality free mock tests for IBPS PO exam on our website. Also, learn how to solve quadratic equation questions of IBPS PO exam and improve your quant section score further. We have similar helpful blogs for several other topics as well. You can find them at the links given below. All the best for your preparation.
Read about Number Series for IBPS PO reasoning section.


