
Data Interpretation Questions for IIFT Set-2 PDF
Download important IIFT Data Interpretation Set-2 Questions PDF based on previously asked questions in IIFT and other MBA exams. Practice Data Interpretation Set-2 Questions and answers for IIFT and other exams.
Download Data Interpretation Questions for IIFT Set-2 PDF
Get 5 IIFT mock tests for Rs. 299. Enroll here
Download IIFT Previous Papers PDF
Take IIFT Mock Tests (With Solutions)
Question 1: Find the equation of the graph shown below.

a) y = 3x – 4
b) y = $2x^{2}$ – 40
c) x = $2y^{2}$ – 40
d) y = $2x^{2}$ + 3x – 19
e) x = $2y^{2}$ + 3x – 19
Instructions
Answer questions based on the following information:
Mulchand Textiles produces a single product of only one quality – waterproof synthetic fabric. Mr.Sharma, the cost accountant of Mulchand Textiles, estimated the costs of Mulchand Textiles for different possible monthly output levels. Before he could tabulate his estimates his computer crashed, and Mr. Sharma lost all data. Fortunately he had some printouts of some incomplete tables, charts and diagrams. The table titled “Variable Cost Estimates of Mulchand Textiles” provided the estimates of labour and material costs.

Apart from labour and material costs Mulchand Textiles incurs administrative costs of Rs. 40,000 per month, and electricity costs. Mr. Sharma recalled that estimate data of variable electricity cost had certain peculiar characteristics. Values at every 25000 sq ft of output increased in geometric progression till 150000 sq ft of output, after which values increased in arithmetic progression for every 25000 sq ft of output. Mr. Sharma remembered that the electricity cost was estimated to be Rs. 3800 for 25000 sq.ft. of output, Rs. 5700 for 50000 square feet of output and Rs. 38856.50 for 175000 square feet of output.
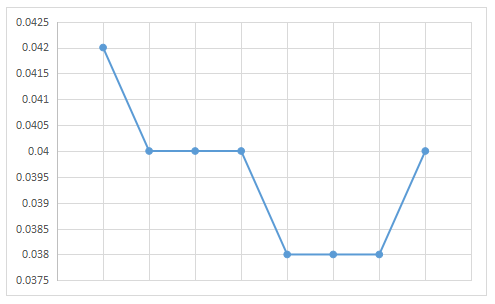
Question 2: The estimated material cost given in the table titled “Variable Cost Estimates of Mulchand Textiles” included the cost of material that gets spoiled in the production process. Mr. Sharma decomposed the estimated material cost into material spoilage cost and material usage cost, but he lost the data when his computer crashed. When he saw the following line diagram, here called that he measured the estimate of material spoilage cost per square feet of output on the y – axis and monthly output on the x – axis.
Estimated material usage cost per square feet of output.
a) Decreases up to 125000 square feet of monthly output and then increases monotonically.
b) Decreases up to 50000 square feet of monthly output, remains constant between 50000 and l00000, decreases between 100000 and 125000, remains constant between 125000 and 175000 and finally increases between 175000 and 200000 of monthly output.
c) Remains constant for all levels of monthly output.
d) Increases up to 50000 square feet of monthly output, remains constant between 50000 and l00000, increases between 100000 and 125000, remain constant between 125000 and 175000 and finally decreases between 175000 and 200000 of monthly output.
e) Increases up to 100000 square feet of monthly output and then decreases monotonically.
Instructions
Answer the questions based on the following graph.

Question 3: If four products P, Q, R and S shown in the graph are sold at price of Rs. 9, Rs. 4, Rs.13 and Rs.3 respectively during 1990-1995, then the total revenue of all the products is lowest in which year?
a) 1991
b) 1992
c) 1993
d) None of the above
Question 4: If four products P, Q, R and S shown in the graph are sold at price of Rs. 9, Rs. 4, Rs.13 and Rs.3 respectively during 1990-1995, then the total revenue of all the products is lowest in which year?
a) 1991
b) 1992
c) 1993
d) None of the above
Instructions
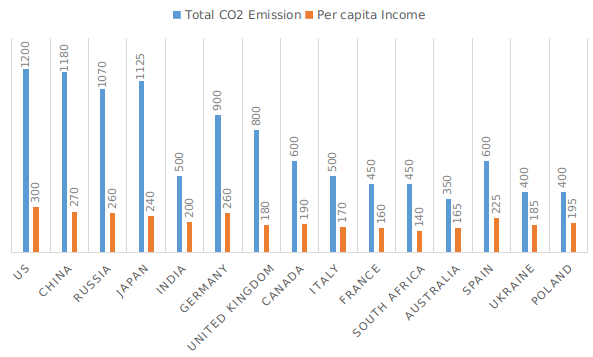
Question 5: Select the wrong statement in reference to the position of India vis-à-vis other countries in the graph in terms of the ratio of $CO_2$ emission to per capita income (increasing order).
a) India stands at 5th position if 50 is added to the given per capita income figures of each country.
b) India stands at 5th position at the given CO2 emission level and per capita income of each country.
c) India stands at 5th position if 200 million ton CO2 emission is deducted from the given CO2 emission figures of each country.
d) India stands at 5th position if 200 million ton CO2 emission is deducted from the given CO2 emission figures of each country and 50 is added to the given per capita income of each country.
Instructions
Based on the information given below, answer the questions which follow.
The occupancy rate of a hotel is the share of available rooms that are occupied during a given time. Figure- I presents quarter wise average hotel occupancy in four regions (Asia-Pacific, America, Europe and Middle East & Africa) for the year 2016. Figure-2, shows the revenue of select hotel chains worldwide in 2016.
Figure-1: Region Wise Average Hotel Occupancy Rates
Occupancy rates

Regions $\rightarrow$
Figure-2: Revenue of Select Hotel Chains Worldwide

Hotels$\rightarrow$
Question 6: Considering the total revenue of the hotel industry in 2016 as 495.17 billion USD. what is the percentage contribution of revenue of select hotel chains to hotel industry revenue?
a) 13
b) 14
c) 15
d) 16
Question 7: For Hilton Worldwide, considering 70% average occupancy rate for 365 days of operations and average room rent of 350 USD per day, the total number of rooms available (in 000’s) in Hilton Worldwide per day approximately are:
a) 150
b) 130
c) 160
d) 170
Question 8: If the number of available rooms in each of the four regions (Asia-Pacific, America, Europe and Middle East & Africa) are in the ratio 1:2:5:4, the average occupancy rate for Quarter-1 are:
a) 62
b) 66
c) 58
d) 60
Question 9: Assuming that there is no change in the number of available rooms in a given year in all four regions, the correct arrangement in the increasing order of average annual occupancy rates is :
a) Asia-Pacific, Europe, America and Middle East & Africa
b) Middle East & Africa, America, Asia-Pacific and Europe
c) Asia-Pacific, America, Middle East & Africa and Europe
d) Middle East & Africa, America, Europe and Asia-Pacific
Instructions
Answer the questions based on the following graph.
Question 10: Four products P, Q, R and S shown in the graph are sold at price of Rs.9, Rs.4, Rs.13 and Rs.3 respectively during 1990-1995. Which of the following statements is TRUE?
a) Product R fetches second highest revenue across products in 1991.
b) Sum of revenue of P, Q and S is more than the revenue of R in 1994.
c) Cumulative revenue of P and Q is more than the revenue of S in 1993.
d) None of the above
Get Complete MBA Test Series for Rs. 799
Answers & Solutions:
1) Answer (D)
When x = -3, y = -10
This is satisfied only in option D.
Hence, option D is the correct answer.
2) Answer (C)
Material cost for 25000 sq. ft output = Rs. 11050
Spoilage cost per sq. ft = 0.042 {Form the graph}
Therefore the spoilage cost for 25000 sq. ft = 25000*0.042 = Rs. 1050. Hence, the usage cost = 11050 – 1050 = Rs. 10000.
Therefore, the usage cost per sq. ft. = $\dfrac{10000}{25000}$ = Rs. 0.40.
Similarly, we can calculate for the remaining output and tabulating the same.
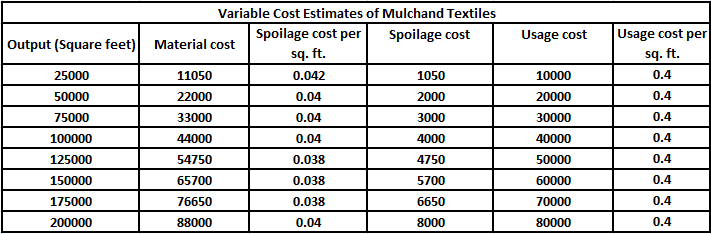
From the table we can see that that the usage cost per sq.ft is the same for all outputs. Hence, we can see that option C is the correct answer.
3) Answer (C)
4) Answer (C)
5) Answer (D)
India stands at 6th position if 200 million ton CO2 emission is deducted from the given CO2 emission figures of each country and 50 is added to the given per capita income of each country.
Hence, option D is the correct answer.
Take IIFT Mock Tests (With Solutions)
6) Answer (C)
7) Answer (B)
8) Answer (A)
9) Answer (B)
10) Answer (C)
Let’s look at the options one by one ,
Option A: Revenue by products P = 25*9 = 225 , Q = 40*4 = 160 , R = 91*13 = 1183, S = 159*3 = 477
Revenue of R is the highest. Hence A is not the correct answer.
Option B: Revenue by products P = 75*9 = 675, Q = 40*4 = 160 , R = 131*13 = 1703, S = 88*3 = 264
Sum of revenues of P, Q, S =1094
The combined revenue of P, Q, S is less than the revenue from R in 1994.
Hence B is not the correct answer.
Option C: Revenue by products P = 35*9 = 315, Q = 60*4 = 240, R = 62*13 = 806, S = 140*3 = 420
The cumulative revenue of P and Q = 555
The cumulative revenue of P and Q is more than the revenue of S in 1993.
Hence C is the correct answer.
IIFT Previous year question papers PDF
We hope this Data Interpretation Set-2 questions and answers for IIFT PDF will be helpful to you.


