
Data Interpretation Questions for CMAT 2022 – Download PDF
Download CMAT 2022 Data Interpretation Questions pdf by Cracku. Very Important Data Interpretation Questions for CMAT 2022 based on asked questions in previous exam papers. These questions will help your CMAT preparation. So kindly download the PDF for reference and do more practice.
Download Data Interpretation Questions for CMAT
Get 5 CMAT mocks at just Rs.299
Download CMAT previous papers PDF
Question 1: Study the bar graph and answer the question.
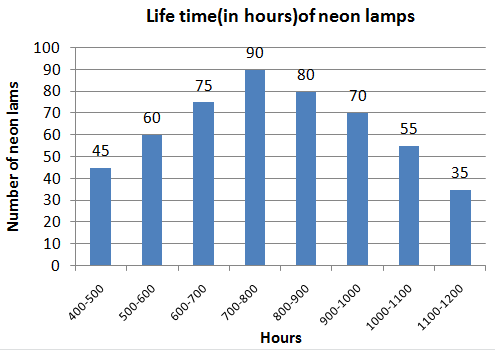
The ratio of the number of neon lamps having a life of 900 hours or more to the number of lamps having life less than 700 hours is:
a) 25 : 21
b) 8 : 9
c) 6 : 7
d) 7 : 8
Question 2: Study the pie chart and answer the question.
Distribution (degree wise) of the number of computers sold by a shopkeeper during five months.
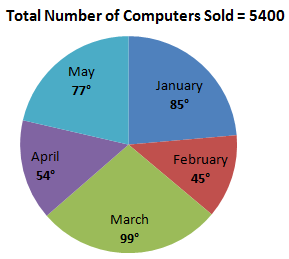
The total number of computers sold in February and April is what percentage more than the number of computers sold in May? (Your answer should be correct to one decimal place.)
a) 25.8
b) 28.6
c) 30.2
d) 26.4
Question 3: Study the graph and answer the question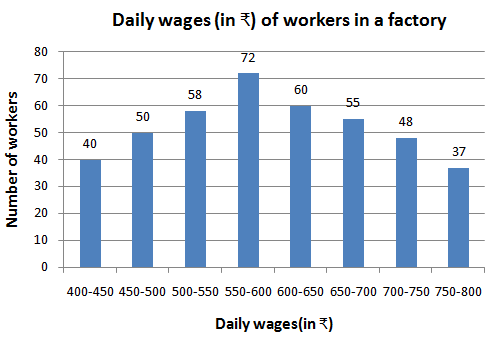
The number of workers in the factory whose daily wages are ₹450 or more but less than ₹600 is
a) 148
b) 180
c) 190
d) 170
Question 4: Study the graph and answer the question.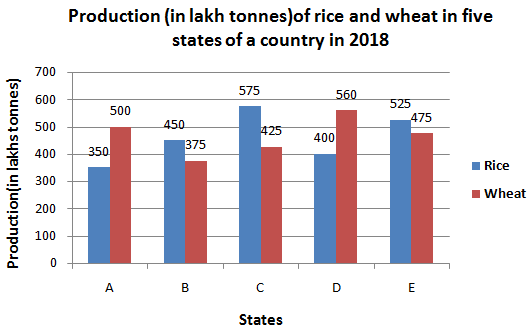
Total production of wheat in states A, B and E is what percentage less than the total production of rice in states C, D and E?
a) 10
b) 12
c) 12.2
d) 11.1
Question 5: Study the pie-chart and answer the question.
Distribution (degree-wise) of the number of employees of a company working in 5 departments A, B, C, D and E.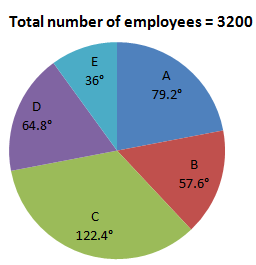
The number of employees working in department C is what percentage more than the total number of employees working in D and E? (Your answer should be correct to one decimal place.)
a) 23.2
b) 20.6
c) 22.8
d) 21.4
Download CMAT Previous Papers PDF
Question 6: Study the given pie chart and answer the question that follows.
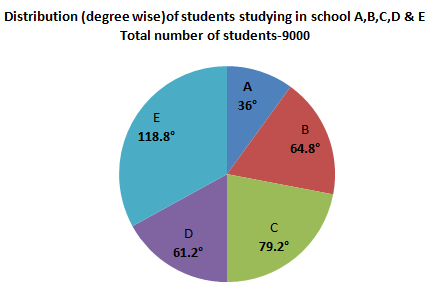
The number of students in school E exceeds the total number of students in schools A and B by x , where x lies between:
a) 420 and 440
b) 400 and 420
c) 440 and 460
d) 460 and 480
Question 7: Study the given graph and answer the question that follows.
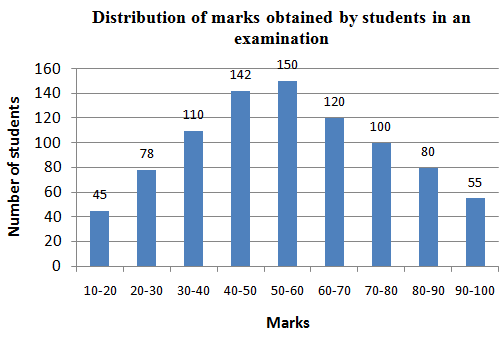
If 60% of the total number of students obtaining 50 marks or more but less than 70 marks are girls and 55% of the total number of students obtaining 70 marks or more but less than 90 marks are also girls, then the total number of girls obtaining 50 marks or more but less than 90 marks is:
a) 236
b) 257
c) 261
d) 207
Question 8: Two different finance companies declare a fixed annual rate of interest on the amount invested by investors with them. The interest rate declared by these companies can vary from year to year depending on the variation in the country’s economy and the interest rate of the banks. The annual rate of interest offered by the two companies P and Q is shown in the graph below.
Study the graph and answer the question.
Annual percentage rate of interest offered by two finance companies P and Q over the years.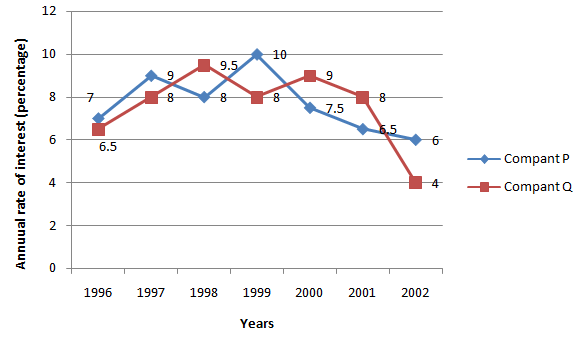 A sum of ₹3.5 lakhs was invested in company Q in the year 2000 for one year. How much more simple interest will accrue if the amount was invested in company P?
a) ₹5,500
b) ₹5,000
c) ₹5,200
d) ₹5,250
Question 9: Study the graph and answer the question.
Percentage Distribution of Total Expenditure of a Company in 2012.
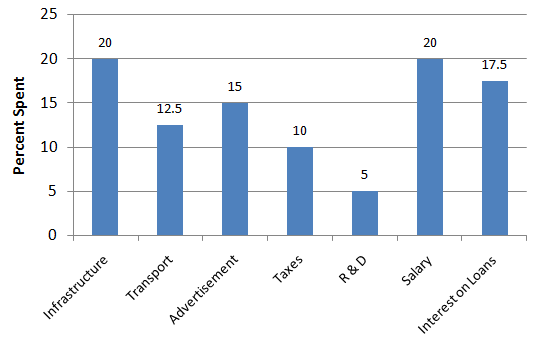
If the total amount of expenditure of the company is x times the expenditure on transport, then the value of x is:
a) 6
b) 8
c) 12
d) 5
Question 10: Two different finance companies declare a fixed annual rate of interest on the amount invested by investors with them. The interest rate declared by these companies can vary from year to year depending on the variation in the country’s economy and the interest rate of the banks. The annual rate of interest offered by the two companies P and Q is shown in the graph below.
Study the graph and answer the question.
Annual percentage rate of interest offered by two finance companies P and Q over the years.

An investor invested a sum of ₹4 lakhs in company in the year 2000. After one year, the entire amount was transferred to company P in 2001 as an investment for one year. What amount will the investor receive from company P?
a) ₹4,54,420
b) ₹4,64,340
c) ₹4,64,430
d) ₹4,56,320
Question 11: The given table shows the number (in thousands) of cars of five different models A, B, C, D and E produced during Years 2012-2017. Study the table and answer the question that follow.
If 2013 and 2014 are put together, which type of cars constitute exactly 25% of the total number of cars produced in those 2 years?
a) E
b) B
c) D
d) C
Question 12: The given table shows the number (in thousands)of cars of five different models A, B. C, D and E produced during Years 2012-2017. Study the table and answer the question that follow.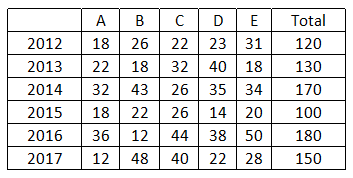
The percentage decrease in the production of which type of car in 2017, with reference to 2016, was the maximum?
a) D
b) E
c) A
d) C
Question 13: The given table represents the number of computers sold by four dealers A, B, C and D during the first six months of 2016. Study the table carefully and answer the question that follows.
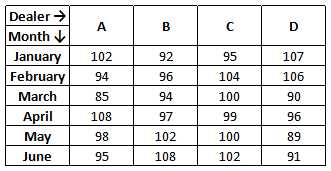
The total number of computers sold by dealer A during February to June is what percentage more than the total number of computers sold byall the dealers in June? (Correct to one decimal place)
a) 25.3
b) 21.2
c) 24.4
d) 17.5
Question 14: The given table represents the production of different types of motorcycles (in thousands)over a period of six years.
Study the table carefully and answer the question that follows.
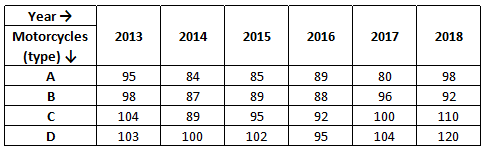
During 2015, the production of which type of motorcycle was more than 25% of the total production of all types of motorcycles in 2017?
a) A
b) B
c) C
d) D
Question 15: The heights of some girls in a school were noted and the data obtained are as shown in the table.
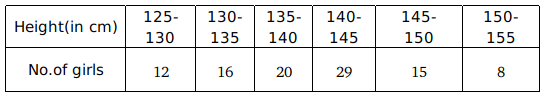
How many girls have a height of 135 cm or more but less than 150 cm?
a) 88
b) 35
c) 80
d) 64
Question 16: The following table shows the income(in rupees) for a particular month, together with their source, in respect of 5 employees (A, B, C, D and E).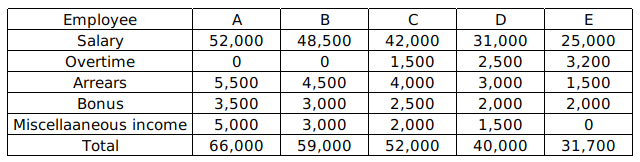
How many employees got more arrears than the average arrears received by all the employees?
a) 4
b) 1
c) 3
d) 2
Question 17: The following table shows the monthly salaries (in ₹) of 50 families.
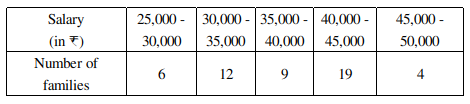
How many families have a monthly salary less than ₹40,000?
a) 46
b) 9
c) 27
d) 18
Question 18: The following table shows the number of students enrolled in different faculties in a college.
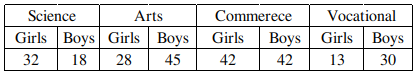
The percentage of students studying in faculties other than Science is:
a) 60%
b) 80%
c) 75%
d) 20%
Question 19: The following table shows the production of fertilizers (in lakh tonne) by six companies for 5 months (January to May).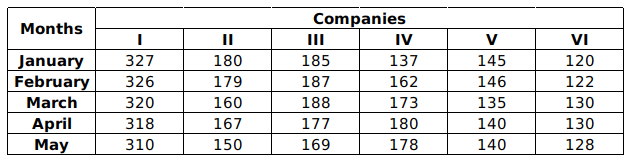
In which month does Company II have a contribution of approximately 20% in the total fertilizer production?
a) March
b) April
c) May
d) January
Question 20: The following table shows the imports and exports (in Rs.crore) of a country over 4 years (2016 to 2019).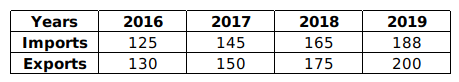 The average trade balance (in Rs.crores) is:
a) 8
b) 12
c) 6
d) 4
Question 21: Study the following table and answer the question.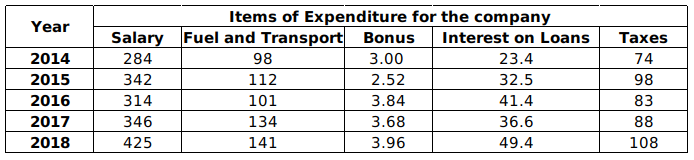
Total expenditure on all the items in 2014 was approximately what percent of the total expenditure in 2018?
a) 68.32%
b) 65.32%
c) 60.32%
d) 66.32%
Question 22: During a medical check-up, the heights of 40 students in a class were recorded as shown in the following table.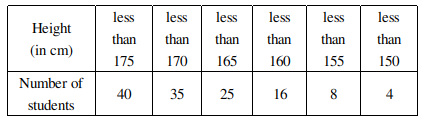 How many students have a height of 165 cm or more?
a) 15
b) 10
c) 25
d) 16
Question 23: The following table shows the daily earnings of 45 skilled workers.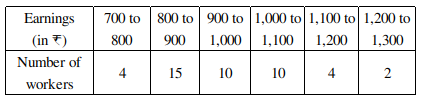
How many workers earn less than ₹1,100 in a day?
a) 39
b) 10
c) 29
d) 43
Question 24: The number of students enrolled in a college is shown in the following table.
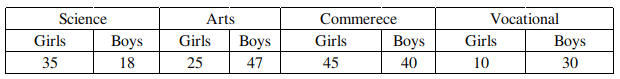
The ratio of the total number of boys to that of girls in the college is:
a) 13 : 42
b) 1:1
c) 23:27
d) 27:23
Question 25: The following table shows the income(in ₹) for a particular month, together with their source, in respect of 5 employees (A, B, C, D and E)
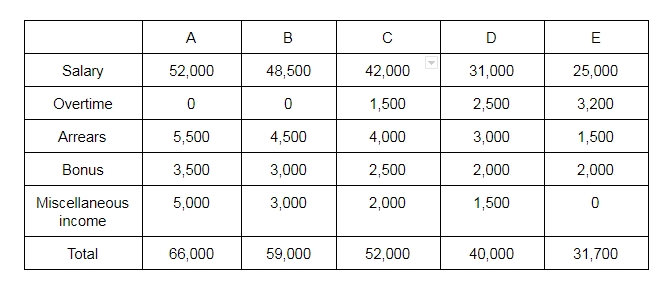
How many employees got more than a total of ₹10,000 as income other than salary?
a) 1
b) 4
c) 3
d) 2
Enroll to CAT 2022 Complete Course
Answers & Solutions:
1) Answer (B)
Number of neon lamps having a life of 900 hours or more = 70 + 55 + 35 = 160
Number of lamps having life less than 700 hours = 45 + 60 + 75 = 180
=> Required ratio = $\frac{160}{180}=8:9$
=> Ans – (B)
2) Answer (B)
in february = $ \dfrac {45}{360} \times 5400 $
$\Rightarrow 675 $
In april $ \dfrac{54}{360} \times 5400$
$\Rightarrow 810 $
again may = $\dfrac{77}{360} \times 5400 $
$\Rightarrow 1155 $
then total computers in February + April = 675 + 810 = 1485
so % more than computers = $\dfrac{ 1485- 1155}{1155}\times 100$
$\Rightarrow \dfrac{330}{1155} \times 100 $
$\Rightarrow 28.6 $ Ans
3) Answer (B)
The number of workers in the factory whose daily wages are Rs 450 or more but less than Rs600 is
from the given D I = 50 + 58+ 72 = 180 Ans
4) Answer (A)
Production of wheat in the state A, B, and E = 500+375+475 = 1350
Production of rice in the state C, D, and E = 575+400+525 = 1500
In % less of A,B and E from C, D and E =$ \dfrac {1500-1350}{1500} \times 100 $
$\Rightarrow \dfrac{150}{1500}\times 100 $
$\Rightarrow 10 $ % Ans
5) Answer (D)
Total Degree of Department D and E = $ 54.8^{\circ} + 36^{\circ}$
$\Rightarrow 100.8 ^ {\circ}$
degree of department C = $ 1.22.8^{\circ}$
The employee of C more than total degree of Department D and E is = $122.8^{\circ} – 100.8^{\circ} = 22^{\circ}$
then in a % = $\dfrac {22}{100.8}\times 100 $
$\Rightarrow 21.8 $ Ans
6) Answer (C)
We need to find X = E – (A + B)
total members of student = 9000
E = $ 9000 \times \dfrac {118.8}{360}$
$\Rightarrow 900 \times \dfrac{1188}{360}$
$\Rightarrow 2970 $
A = $\dfrac {36}{360}$ = 900
B = $ 9000\times \dfrac {64.8}{360}$
$\Rightarrow 90 \times {648}{36}$
$\Rightarrow 1620 $
X = E – (A + B)
$\Rightarrow 2970 + (900+1620)$
$\Rightarrow 450 $
then we can say x is lies between 440 and 460 from given option Ans
7) Answer (C)
From the given DI 50-60 = 150 and 60-70 = 120
then total student = 150 + 120 = 270
according to question girls =$270 \times .60 = 162 $
again range 70 -80 = 100 student and 80-90 = 80 student
then total student = 100 + 180 = 180
according to question girls = $ 180 \times 0.55 = 99 $
so total girls = 162 + 99 = 261 Ans
8) Answer (D)
Note that, the annual rate offered by company Q and p for the year 2000 is 9% and 7.5% form given Di in other words,
company Q is offering 1.5 more than p
so for a sum of Rs 3.5 lakhs company Q simply interest will accrue more than p
$\Rightarrow 3.5 lakh\times 1.5$%
$\Rightarrow 350000 \times \dfrac{1.5}{100}$
$\Rightarrow 350\times 15 $
$\Rightarrow 5250$ RsAns
9) Answer (B)
Total expenditure = 100%
total expenditure in transport is = 12.5%
so $12.5 \times x = 100 $ (according to question)
$\Rightarrow x $ = 8 Ans
10) Answer (B)
Given that principle amount = 400000
in the year 2000 Rate of interest = 9%
we know that Simple interest (SI) = $\dfrac{PRT}{100} = \dfrac { 400000 \times 9 \times 1} {100}$
$\Rightarrow 36000 $
total amount 400000 + 36000 = 436000
According to question principle amount for 2001 in company P
Simple intrest = $\dfrac{436000 \times 1 \times 6.5} {100} $
$\Rightarrow 436 \times 65 $
$\Rightarrow 28340 $
Total amount = 436000 + 28340 = 464340 Ans
11) Answer (C)
The total number of cars produced in 2013 and 2014 = 130 + 170 = 300
25% of the total number of cars produced in 2013 and 2014 = 300 $\times \frac{25}{100}$ = 75
Production of A type of cars = 22 + 32 = 54
Production of B type of cars = 18 + 43 = 61
Production of C type of cars = 32 + 26 = 58
Production of D type of cars = 40 + 35 = 75
Production of E type of cars = 18 + 34 = 52
$\therefore$ D type of cars constitute exactly 25% of the total number of cars produced in 2013 and 2014.
12) Answer (C)
The percentage decrease in the production of A type of car in 2017, with reference to 2016 = $\frac{36 – 12}{36} \times 100 = \frac{24}{36} \times 100 = 66.66%
B type of car have increments in the production in 2017, with reference to 2016.
The percentage decrease in the production of C type of car in 2017, with reference to 2016 = $\frac{44 – 40}{44} \times 100 = \frac{4}{44} \times 100 = 9.09%
The percentage decrease in the production of D type of car in 2017, with reference to 2016 = $\frac{38 – 22}{38} \times 100 = \frac{16}{38} \times 100 = 42.1%
The percentage decrease in the production of E type of car in 2017, with reference to 2016 = $\frac{50 – 28}{50} \times 100 = \frac{22}{50} \times 100 = 44%
A type of car have maximum decrements in the production in 2017, with reference to 2016.
13) Answer (B)
The total number of computers sold by dealer A during February to June = 94 + 85 + 108 + 98 + 95 = 480
Total number of computers sold by all the dealers in June = 95 + 108 + 102 + 91 = 396
Required percentage = $\frac{480 – 396}{396} \times 100 = \frac{84}{396} \times 100$ = 21.2%
14) Answer (D)
Total production of all types of motorcycles in 2017 = 80 + 96 + 100 + 104 = 380
25% of the total production of all types of motorcycles in 2017 = 380 $\times \frac{25}{100}$ = 95
During 2015, the production of D type of motorcycle was more than 25% of the total production of all types of motorcycles in 2017
15) Answer (D)
Number of girls have a height of 135 cm or more but less than 150 cm = 20 + 29 + 15 = 64
16) Answer (C)
The average arrears received by all the employees = sum of terms/number of terms = $\frac{5500 + 4500 + 4000 + 3000 + 1500}{5}$ = 18500/5 = 3700
Required number = 3
$\therefore$ 3 employees(A, B and C) got more arrears than the average arrears received by all the employees.
17) Answer (C)
Number of families which have monthly salary less than ₹40,000 = 6 + 12 + 9 = 27
18) Answer (B)
Total number of student = 32 + 18 + 28 + 45 + 42 + 42 + 13 + 30 = 250
Total number of student in Arts, commerce, vocational = 28 + 45 + 42 + 42 + 13 + 30 = 200
Required percentage = $\frac{200}{250} \times 100 = 80%
19) Answer (B)
The total fertilizer production in company II = 180 + 179 + 160 + 167 + 150 = 836
20% of the total fertilizer production in company II = 836 $\times \frac{20}{100}$ = 167.2
$\therefore$ In April month company II have a contribution of approximately 20% in the total fertilizer production.
20) Answer (A)
Trade balance (in Rs.crores) in 2016 = 130 – 125 = 5
Trade balance (in Rs.crores) in 2017 = 150 – 145 = 5
Trade balance (in Rs.crores) in 2018 = 175 – 165 = 10
Trade balance (in Rs.crores) in 2019 = 200 – 188 = 12
Average trade balance (in Rs.crores) = $\frac{5 + 5 + 10 + 12}{4}$ = 32/4 = 8
21) Answer (D)
Total expenditure on all the items in 2014 = 284 + 98 + 3 + 23.4 + 74 = 482.4
Total expenditure on all the items in 2018 = 425 + 141 + 3.96 + 49.4 + 108 = 727.36
Required percentage = $\frac{482.4}{727.36} \times 100 = 66.32%
22) Answer (A)
Number of students which have a height of 165 cm or more = total student – less than 165 = 40 – 25 = 15
23) Answer (A)
Number of workers earn less than ₹1,100 in a day = 4 + 15 + 10 + 10 = 39
24) Answer (D)
Total number of boys = 18 + 47 + 40 + 30 = 135
Total number of girls = 35 + 25 + 45 + 10 = 115
The ratio of the total number of boys to that of girls in the college = 135 : 115 = 27 : 23
25) Answer (D)
Salary of A = 52000
Other income = total – salary
Other income of A = 66000 – 52000 = 14000
Salary of B = 48500
Other income of B = 59000 – 48500 = 10500
Salary of C = 42000
Other income of C = 52000 – 42000 = 10000
Salary of D = 31000
Other income of D = 40000 – 31000 = 9000
Salary of E = 25000
Other income of E = 31700 – 25000 = 6700
$\therefore$ 2 employees(A and B) got more than a total of ₹10,000 as income other than salary.


