
CMAT Pie Chart Questions [Download PDF]
Download Pie Chart Questions for CMAT PDF – CMAT Pie Chart questions PDF by Cracku. Practice CMAT solved Pie Chart Questions paper tests, and these are the practice question to have a firm grasp on the Pie Chart topic in the XAT exam. Top 20 very Important Probability Questions for XAT based on asked questions in previous exam papers. The CMAT question papers contain actual questions asked with answers and solutions.
Download Pie Chart Questions for CMAT
Enroll to CMAT 2023 Crash Course
Instructions
Please answer the following three questions based on the data given in the following table
and the notes below.
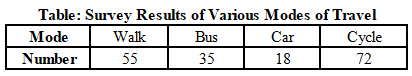
Notes:
A. 1 in 8 of the people who cycled to work were found to be over 65 years of age.
B. 1 in 3 of the cyclists stated that they travelled to work by bus on rainy days.
Question 1: If this data is represented in a pie chart, then how many degrees of arc in the pie chart represent each response in the survey results?
a) 4
b) 8
c) 6
d) 2
1) Answer (D)
Solution:
There are total 360 degrees in pie chart and there are total of 180 responses. Therefore, each response is represented by two degrees of arc in the pie chart.
Answer is option D.
Question 2: What is the share of respondents who cycled to work and were 65 years old?
a) 0.07
b) 0.125
c) 0.05
d) 0.4
2) Answer (C)
Solution:
Number of people who cycled to work and were 65 years old = $\frac{1}{8}\times\ 72$ = 9
Share = $\frac{9}{55+35+18+72}$ = $\frac{9}{180}$ = 0.05
Answer is option C.
Question 3: On rainy days, the ratio of people who went by bus and by cycle is approximately_____________
a) 0.75:1
b) 1:0.9
c) 1.5:1
d) 1.25:1
3) Answer (D)
Solution:
It is mentioned that 1 in 3 of the cyclists stated that they travelled to work by bus on rainy days.
On rainy days, number of people who went by bus = 35 + $\frac{1}{3}$(72) = 59
On rainy days, number of people who went by cycle = 72 – 24 = 48
Ratio = $\frac{59}{48}:1$ $\approx\ $ 1.25:1
Answer is option D.
Instructions
Answer the questions based on the following information given below.
The exhibit given below compares the countries (first column) on different economic indicators (first row), from 2000-2010. A bar represents data for one year and a missing bar indicates missing data. Within an indicator, all countries have same scale.
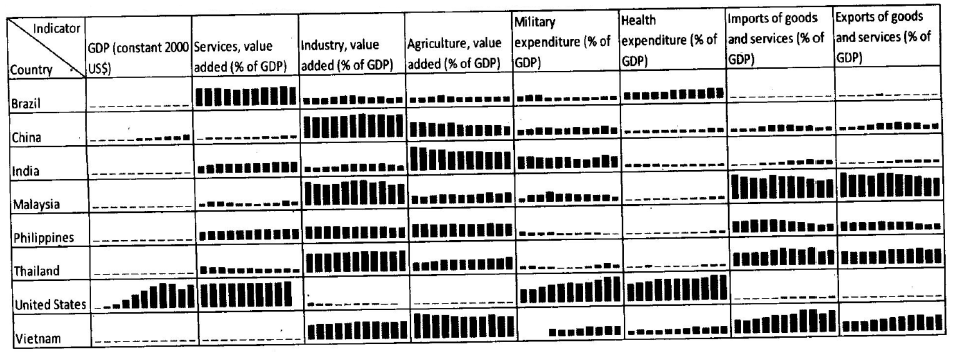
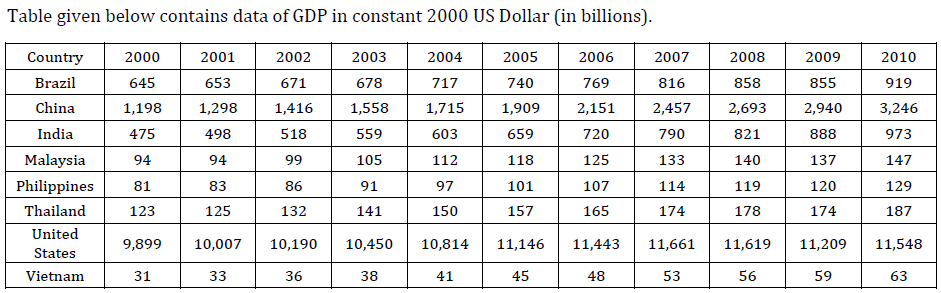
Question 4: Which country (and which year) has witnessed maximum year-to-year decline in “industry as percentage of GDP”? Given that the maximum value of industry as percentage of GDP is 49.7% and the minimum value of industry as percentage of GDP is 20.02%, in the chart above.
a) United States in 2002-3
b) Brazil in 2006-7
c) India in 2009-10
d) Malaysia in 2008-9
e) China in 2008-9
4) Answer (D)
Solution:
This change can be observed by viewing the chart.
Where all other countries saw a gradual drop in their “industry as a % of GDP”, for Malaysia in 2008-09, the fall was sudden and had the maximum value among the options.
Hence, option D is the answer.
Instructions
Directions for the following three questions: Answer the questions based on the pie charts given below.
Chart 1 shows the distribution of 12 million tonnes of crude oil transported through different modes over a specific period of time.
Chart 2 shows the distribution of the cost of transporting this crude oil. The total cost was Rs. 30 million.
<img “=”” alt=”” class=”img-responsive” src=”https://cracku.in/media/questionGroup/DI_7_1.png”/>
Question 5: From the charts given, it appears that the cheapest mode of transport is
a) road
b) rail
c) pipeline
d) ship
5) Answer (A)
Solution:
Cheapest mode of transport will be the one which will have highest transport volume and comparatively lowest cost. We can figure out from the graph that Road have wide gap with very less costs.
For Road, Cost = 6/22
For Rail, Cost = 12/9
For Pipeline, = 65/49
For Ship, Cost = 10/9
Lowest cost is for road.
Question 6: The percentage of customers of two network operators P and Q across the cities A, B, C, D, E is shown in the given pie charts.
.png)
_GsJdYoJ.png)
Based on the information in the pie charts. if the customers of operator P are 3.6 lakhs. and the customers of operator Q are 4.2 lakhs, then in the city C, the positive difference between the customers of the operators is:
a) 44,500
b) 42,600
c) 52,000
d) 48,000
6) Answer (B)
Solution:
From the pie charts,
The customers of P in city C = $\frac{15}{100}\times360000=15\times3600=54,000$
The customers of Q in city C = $\frac{23}{100}\times420000=15\times4200=96,600$
$\therefore\ $Difference = 96600 – 54000 = 42,600
Hence, the correct answer is Option B
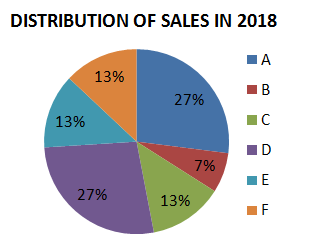
Question 7: The pie charts show the market share of companies in the rice market in 2017 and 2018. The value of sales of Company A in 2017 was ₹40 lakhs. If its sales grew by 25% in 2018, what was approximate value of sales of company B in 2018?
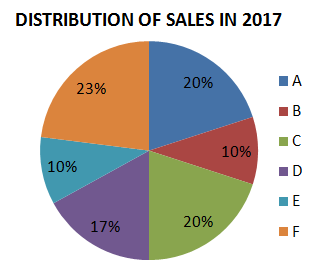
a) ₹12.56 lakhs
b) ₹13.96 lakhs
c) ₹12.96 lakhs
d) ₹13.56 lakhs
7) Answer (C)
Solution:
Value of sales of Company A in 2017 = Rs.40 lakhs
Value of sales of Company A in 2018 = 125% of Rs.40 lakhs = Rs.50 lakhs which is 27% of sales of all companies
27% –> Rs.50 lakhs
7% –> $\dfrac{7 \times 50}{27} = 12.96$ lakhs
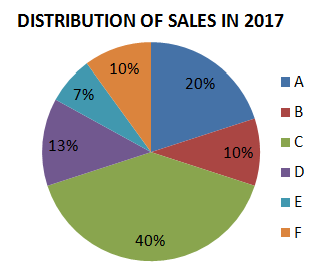
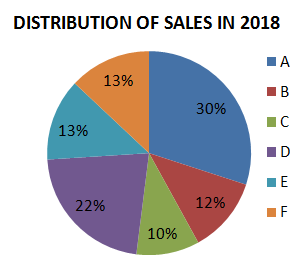
Question 8: The pie charts show the market share of the companies in the detergent market in 2017 and 2018. The total size of the market has decreased from ₹ 300 crores to ₹ 200 crores. What is the decrease in the sales of Company F?
a) $14\frac{1}{3}$%
b) $12\frac{1}{3}$%
c) $33\frac{1}{3}$%
d) $13\frac{1}{3}$%
8) Answer (D)
Solution:
Sales of Company F in 2017 = 10% of Rs.300 crore = Rs.30 crore
Sales of Company F in 2018 = 13% of Rs.200 crore = Rs.26 crore
Decrease in sales = $\dfrac{30-26}{30}\times100 = \dfrac{40}{3}$% $= 13\dfrac{1}{3}$%
Question 9: Study the following pie-charts carefully to answer the questions.
Percentage break-up of number of children in five different villages
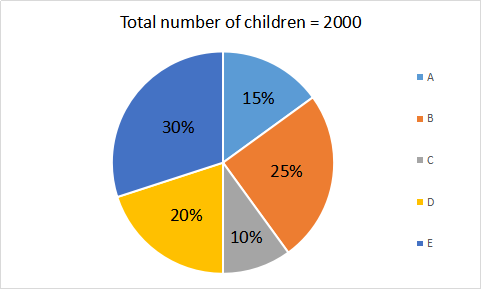
What is the total number of children in villages B and E ?
a) 1200
b) 1400
c) 1145
d) 1100
9) Answer (D)
Solution:
Number of children in B = 25% of 2000
Number of children in E = 30% of 2000
Total number of children in B and E together = 25% of 2000 + 30% of 2000 = 55% of 2000 = 1100.
Question 10: The pie graph shows the distribution of employees working in five departments A, B, C, D and E of a company.
Total number of employees = 9000
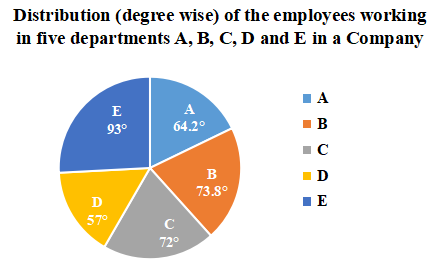
If the number of employees working in department A is x and the total number of employees working in departments C and E is y, then the value of y – 2x is:
a) 725
b) 850
c) 1000
d) 915
10) Answer (D)
Solution:
Number of employees working in department A = x = $\frac{64.2^{\circ\ }}{360^{\circ\ }}\times9000$ = 1605
x = 1605
Number of employees working in department C = $\frac{72^{\circ\ }}{360^{\circ\ }}\times9000$ = 1800
Number of employees working in department E = $\frac{93^{\circ\ }}{360^{\circ\ }}\times9000$ = 2325
The total number of employees working in departments C and E = y = 1800 + 2325 = 4125
y = 4125
y – 2x = 4125 – 2(1605) = 4125 – 3210 = 915
Hence, the correct answer is Option D
Question 11: The following Pie chart represents the percentage-wise distribution of 800 students of class XII in a school in six different sections A, B, C, D, E and F.
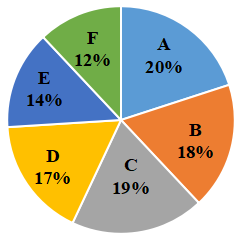
The table given below shows the number of girls of class XII in six different sections A, B, C, D, E and F.
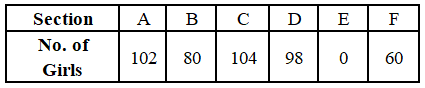
The total number of girls in sections B, C and D together is what percent more than the total number of boys in sections A, B and D together?
a) 50
b) 76.25
c) 65.75
d) 80
11) Answer (B)
Solution:
Number of students in section A = $\frac{20}{100}\times$800 = 160
Number of boys in section A = 160 – 102 = 58
Number of students in section B = $\frac{18}{100}\times$800 = 144
Number of boys in section B = 144 – 80 = 64
Number of students in section D = $\frac{17}{100}\times$800 = 136
Number of boys in section D = 136 – 98 = 38
Total number of boys in sections A, B and D together = 58 + 64 + 38 = 160
Total number of girls in sections B, C and D together = 80 + 104 + 98 = 282
Required percentage = $\frac{282-160}{160}\times$100
= $\frac{122}{160}\times$100
= 76.25%
Hence, the correct answer is Option B
Question 12: Pie-Chart shows the degree wise breakup of expenditure of a family in a month. Total income of the family is ₹144000.
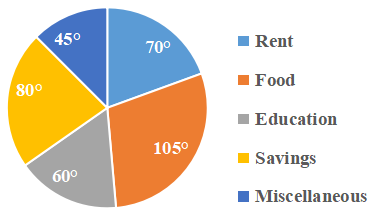
What is the expenditure (in ₹) on education?
a) 12000
b) 24000
c) 36000
d) 20000
12) Answer (B)
Solution:
The expenditure on education = $\frac{60}{360}\times$144000
= ₹24000
Hence, the correct answer is Option B
Question 13: The pie-chart shows the percentage-wise distribution of the number of students in five different schools P, Q, R, S and T. The total number of students in all five schools together is 10,500.
Study the pie-chart and answer the question.

The number of students in school R is what per cent of the total number of students in schools Q and T together?
a) 40%
b) 35%
c) 25%
d) 30%
13) Answer (D)
Solution:
Given, total number of students in all schools = 10,500
From the pie-chart,
Number of students in school R = $\frac{12}{100}\times10500=1260$
Number of students in school Q and T together = $\frac{16+24}{100}\times10500=\frac{40}{100}\times10500=4200$
$\therefore\ $Required percentage = $\frac{1260}{4200}\times100=$ 30%
Hence, the correct answer is Option D
Question 14: The pie-chart shows the percentage-wise distribution of the number of students in five different schools P, Q, R, S and T. The total number of students in all five schools together is 10,500.
Study the pie-chart and answer the question.

The difference between the central angles corresponding to schools T and R is:
a) $42.8^\circ$
b) $44^\circ$
c) $43.2^\circ$
d) $34.5^\circ$
14) Answer (C)
Solution:
From the pie-chart,
Central angle corresponding to school T = $\frac{24}{100}\times360^{\circ}$ = $86.4^{\circ\ }$
Central angle corresponding to school R = $\frac{12}{100}\times360^{\circ}$ = $43.2^{\circ\ }$
$\therefore\ $The difference between the central angles corresponding to schools T and R = $86.4^{\circ}-43.2^{\circ}=43.2^{\circ}$
Hence, the correct answer is Option C
Question 15: The given pie-chart represents the percentage of students enrolled in five different sports. The total number of students is 2800.

What is the average number of students enrolled in Hockey and Tennis together?
a) 560
b) 580
c) 540
d) 460
15) Answer (A)
Solution:
Given, total number of students = 2800
From the pie-chart,
Number of students enrolled in Hockey = $\frac{26}{100}\times2800=728$
Number of students enrolled in Tennis = $\frac{14}{100}\times2800=392$
$\therefore\ $Average number of students enrolled in Hockey and Tennis together = $\frac{728+392}{2}=\frac{1120}{2}=560$
Hence, the correct answer is Option A


