 91- 6303239042
Suppose vial C tests positive and vials A, E and H test negative. Which patient has the disease?
Sign in
Please select an account to continue using cracku.in
↓ →
 CAT WhatsApp Group
Sixteen patients in a hospital must undergo a blood test for a disease. It is known that exactly one of them has the disease. The hospital has only eight testing kits and has decided to pool blood samples of patients into eight vials for the tests. The patients are numbered 1 through 16, and the vials are labelled A, B, C, D, E, F, G, and H. The following table shows the vials into which each patient’s blood sample is distributed.
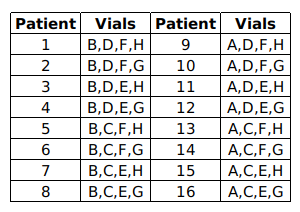
If a patient has the disease, then each vial containing his/her blood sample will test positive. If a vial tests positive, one of the patients whose blood samples were mixed in the vial has the disease. If a vial tests negative, then none of the patients whose blood samples were mixed in the vial has the disease.
Suppose vial C tests positive and vials A, E and H test negative. Which patient has the disease?
The patients in
Vial A: 9, 10, 11, 12, 13, 14, 15, 16
Vial B: 1, 2, 3, 4, 5, 6, 7, 8.
Vial C: 5,6,7,8,13,14,15,16
Vial D:1,2,3,4,9,10,11,12
Vial E:3,4,7,8,11,12,15,16
Vial F:1,2,5,6,9,10,13,14
Vial G:2,4,6,8,10,12,14,16
Vial H:1,3,5,7,9,11,13,15
If vial C tests positive and vials A, E and H test negative then Patient 6 must have disease as all other patients in Vial C expect patient 6 are present in at least one of A, E, H.
Suppose vial A tests positive and vials D and G test negative. Which of the following vials should we test next to identify the patient with the disease?
The patients in
Vial A: 9, 10, 11, 12, 13, 14, 15, 16
Vial B: 1, 2, 3, 4, 5, 6, 7, 8.
Vial C: 5,6,7,8,13,14,15,16
Vial D:1,2,3,4,9,10,11,12
Vial E:3,4,7,8,11,12,15,16
Vial F:1,2,5,6,9,10,13,14
Vial G:2,4,6,8,10,12,14,16
Vial H:1,3,5,7,9,11,13,15
Suppose vial A tests positive and vials D and G test negative then the patient who tested positive must be one of patient 13 or 15.
Patient 13 or 15 are not present in vial B. So, A is not the answer.
Both patients present in vial C. Even if tested positive or negative we can't know who has got the disease. So, C is not the answer.
Both patients present in vial H. Even if tested positive or negative we can't know who has got the disease. So, H is not the answer.
only patient 15 is present in vial E, if tested positive then patient 15 has the disease else patient 13 as disease.
Hence Option 2 is correct.
Which of the following combinations of test results is NOT possible?
The patients in
Vial A: 9, 10, 11, 12, 13, 14, 15, 16
Vial B: 1, 2, 3, 4, 5, 6, 7, 8.
Vial C: 5,6,7,8,13,14,15,16
Vial D:1,2,3,4,9,10,11,12
Vial E:3,4,7,8,11,12,15,16
Vial F:1,2,5,6,9,10,13,14
Vial G:2,4,6,8,10,12,14,16
Vial H:1,3,5,7,9,11,13,15
If vials C and D negative then no patient could test negative. Hence A is correct answer.
Suppose one of the lab assistants accidentally mixed two patients' blood samples before they were distributed to the vials. Which of the following correctly represents the set of all possible numbers of positive test results out of the eight vials?
Let one of the patients, patient 1 or patient 16 has the disease and his blood is mixed with other them all 8 vials will tests positive. ⇒
8 has to be one of the answers.
If patient 2 and patients 16’s blood is mixed of one of them has the disease then 7 of the 8 vials will test positive. So 7 has to be there in the option.
If 1 has the disease and 1, 7 are mixed then 6 out the 8 vials tests positive.
IF 1 has the disease and 1,9 are mixed then 5 of the 8 vials tests positive,
Now, let us assume that patient 1 has the disease if his blood is not mixed,
then 4 vials will definitely show positive.
Hence 3 is the correct answer.
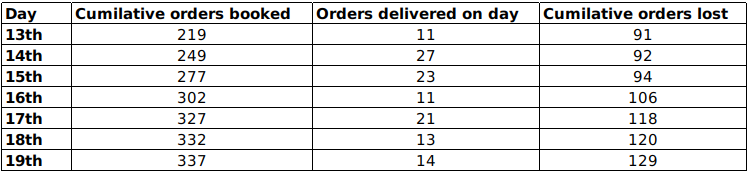
XYZ organization got into the business of delivering groceries to home at the beginning of the last month. They have a two-day delivery promise. However, their deliveries are unreliable. An order booked on a particular day may be delivered the next day or the day after. If the order is not delivered at the end of two days, then the order is declared as lost at the end of the second day. XYZ then does not deliver the order, but informs the customer, marks the order as lost, returns the payment and pays a penalty for non-delivery. The following table provides details about the operations of XYZ for a week of the last month. The first column gives the date, the second gives the cumulative number of orders that were booked up to and including that day. The third column represents the number of orders delivered on that day. The last column gives the cumulative number of orders that were lost up to and including that day. It is known that the numbers of orders that were booked on the 11th, 12th, and 13th of the last month that took two days to deliver were 4, 6, and 8 respectively
Among the following days, the largest fraction of orders booked on which day was lost?
The cumulative orders booked by 19th are 337 and that of 18th are 332=> No. orders booked on 19th are 5
Similarly we can find the orders booked on that day till 14th.
Number of orders lost that were booked on 12th = Cumulative orders lost till 14th-Cumulative orders lost till 13th =92-91=1
Similarly, the number of orders lost till 17th can be found out.
Number of orders delivered on 13th are 11 out of which 4 are orders which were booked in 11th so, 7 must be the orders which were booked on 12th.
Similarly, we can find the orders which took 1day and 2 days to get delivered till 17th.
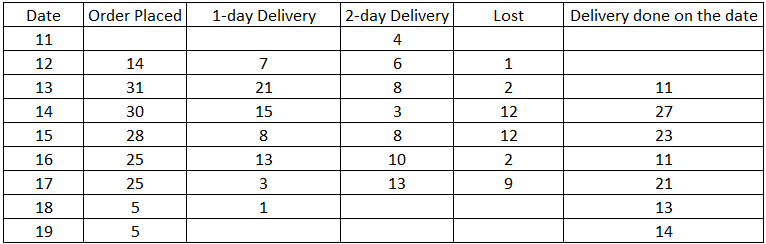
Now, total number of orders booked on 12th will be 7+6=1=14.
Fraction of orders booked on 15th that were lost = 12/28
Fraction of orders booked on 16th that were lost = 2/25
Fraction of orders booked on 13th that were lost =2/31
Fraction of orders booked on 14th that were lost = 12/30.
.'. Option A is correct answer.
On which of the following days was the number of orders booked the highest?
The cumulative orders booked by 19th are 337 and that of 18th are 332=> No. orders booked on 19th are 5
Similarly we can find the orders booked on that day till 14th.
Number of orders lost that were booked on 12th = Cumulative orders lost till 14th-Cumulative orders lost till 13th =92-91=1
Similarly, the number of orders lost till 17th can be found out.
Number of orders delivered on 13th are 11 out of which 4 are orders which were booked in 11th so, 7 must be the orders which were booked on 12th.
Similarly, we can find the orders which took 1day and 2 days to get delivered till 17th.
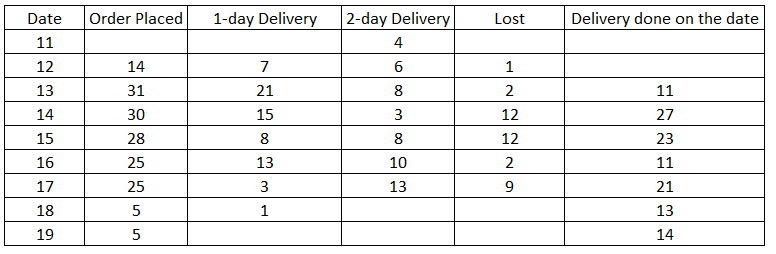
Now, total number of orders booked on 12th will be 7+6=1=14.
The total number of orders placed on 13th = 21+8+2 = 31
FRom the table we can determine that among options, number of orders booked on 13th are maximum.
The delivery ratio for a given day is defined as the ratio of the number of orders booked on that day which are delivered on the next day to the number of orders booked on that day which are delivered on the second day after booking. On which of the following days, was the delivery ratio the highest?
The cumulative orders booked by 19th are 337 and that of 18th are 332=> No. orders booked on 19th are 5
Similarly we can find the orders booked on that day till 14th.
Number of orders lost that were booked on 12th = Cumulative orders lost till 14th-Cumulative orders lost till 13th =92-91=1
Similarly, the number of orders lost till 17th can be found out.
Number of orders delivered on 13th are 11 out of which 4 are orders which were booked in 11th so, 7 must be the orders which were booked on 12th.
Similarly, we can find the orders which took 1day and 2 days to get delivered till 17th.
Now, total number of orders booked on 12th will be 7+6=1=14.
From the table we can determine that among options, number of orders booked on 13th are maximum.
For 15 the delivery ratio = 8/8 = 1
For 16 the delivery ratio = 13/10 = 1.3
For 13 the delivery ratio = 21/8 = 2.625
For 14 the delivery ratio = 15/3 = 5
Hence Option D
The average time taken to deliver orders booked on a particular day is computed as follows. Let the number of orders delivered the next day be x and the number of orders delivered the day after be y. Then the average time to deliver order is $$\frac{(x+2y)}{(x+y)}$$. On which of the following days was the average time taken to deliver orders booked the least?
The cumulative orders booked by 19th are 337 and that of 18th are 332=> No. orders booked on 19th are 5
Similarly we can find the orders booked on that day till 14th.
Number of orders lost that were booked on 12th = Cumulative orders lost till 14th-Cumulative orders lost till 13th =92-91=1
Similarly, the number of orders lost till 17th can be found out.
Number of orders delivered on 13th are 11 out of which 4 are orders which were booked in 11th so, 7 must be the orders which were booked on 12th.
Similarly, we can find the orders which took 1day and 2 days to get delivered till 17th.
Now, total number of orders booked on 12th will be 7+6=1=14.
FRom the table we can determine that among options, number of orders booked on 13th are maximum.
Average time can be calculated as follows
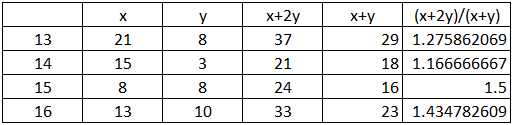
14 is the least
A farmer had a rectangular land containing 205 trees. He distributed that land among his four daughters - Abha, Bina, Chitra and Dipti by dividing the land into twelve plots along three rows (X,Y,Z) and four Columns (1,2,3,4) as shown in the figure below:
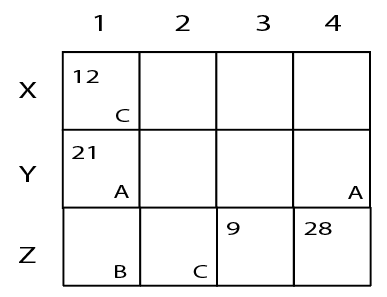
The plots in rows X, Y, Z contained mango, teak and pine trees respectively. Each plot had trees in non-zero multiples of 3 or 4 and none of the plots had the same number of trees. Each daughter got an even number of plots. In the figure, the number mentioned in top left corner of a plot is the number of trees in that plot, while the letter in the bottom right corner is the first letter of the name of the daughter who got that plot (For example, Abha got the plot in row Y and column 1 containing 21 trees). Some information in the figure got erased, but the following is known:
1. Abha got 20 trees more than Chitra but 6 trees less than Dipti.
2. The largest number of trees in a plot was 32, but it was not with Abha.
3. The number of teak trees in Column 3 was double of that in Column 2 but was half of that in Column 4.
4. Both Abha and Bina got a higher number of plots than Dipti.
5. Only Bina, Chitra and Dipti got corner plots.
6. Dipti got two adjoining plots in the same row.
7. Bina was the only one who got a plot in each row and each column.
8. Chitra and Dipti did not get plots which were adjacent to each other (either in row / column / diagonal).
9. The number of mango trees was double the number of teak trees.
How many mango trees were there in total?
There are 12 plots and each of them got even number of plots. So, possible cases are 4,4,2,2 or 6,2,2,2.
From 4, A and B got more plots than D. So, the only possible case is A, B each got 4 and C,D each got 2.
From 6, D has to get two adjacent plots and From 8, plots of C, D are nit adjacent to each other => D must have got plots in X3, X4.
C already has two plots in X1, Z2. So, the corner plot Z4 should belong to B.
From 7, B has a plot in each row and each column. So, X2 should belong to B.
Now, out of the remaining Y2, Y3, Y4 and Z3 three plots belong to A and one belongs to B.
Till now B hasn't got any plot in Third column and 2nd row.
So, Y3 belongs to B and Y2, Y4, Z3 belongs to A.
Let the number of trees in Y4 be 4x from 3, number of trees in Y3, Y2 will be 2x, x respectively.
The number of teak trees=7x+21
.'. Number of mango trees=14x+42
The table now looks like:
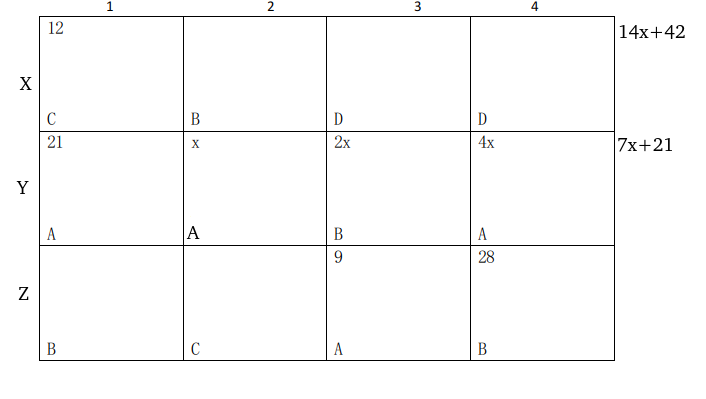
Each plot had trees in non-zero multiples of 3 or 4 and none of the plots had the same number of trees and from 2, B didn't have the largest number of trees in a plot => x<8.
x can't be 7,5,3,2,1 as for these cases at least one of x,2x,4x is neither multiple of 3 or 4.
x can be 6 or 4.
If x=6, number of Teak trees will be 63 and Mango trees will be 126 => Number of Pine trees= 205-126-63=16 but number of trees in Z3+Z4>16 so, x$$\ne\ $$6.
If x=4, Number of Teak trees=49 and Mango trees=98 => Number of Pine trees=58. Valid case.
Number of trees with A= 30+5x=50.
From 1, number of trees with C, D= 30, 56 respectively.
So, number of trees in Z2= 18.
.'. Number of trees with B= 205-50-30-56=69.
From 2, largest number of trees in a plot is 32. They can be in the plot of either B or D. If they are from B, they have to be from X2 but in that case number of trees in Z1=1 which is neither a multiple of 3 or 4.
So, highest number of trees in a plot are with D and it is 32 -=> number of trees in X3, X4 are 32, 24 in any order.
So, number of trees in X2= 98-56-12=30
.'. Number of trees in Z1=69-30-28-8=3.
The final table will look like:
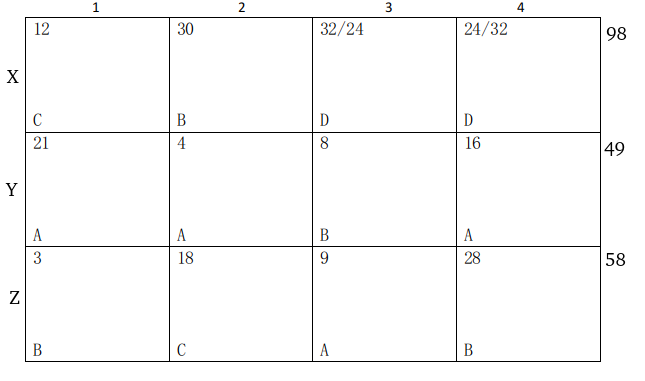
.'. Number of Mango trees=98.
Which of the following is the correct sequence of trees received by Abha, Bina, Chitra and Dipti in that order?
There are 12 plots and each of them got even number of plots. So, possible cases are 4,4,2,2 or 6,2,2,2.
From 4, A and B got more plots than D. So, the only possible case is A, B each got 4 and C,D each got 2.
From 6, D has to get two adjacent plots and From 8, plots of C, D are nit adjacent to each other => D must have got plots in X3, X4.
C already has two plots in X1, Z2. So, the corner plot Z4 should belong to B.
From 7, B has a plot in each row and each column. So, X2 should belong to B.
Now, out of the remaining Y2, Y3, Y4 and Z3 three plots belong to A and one belongs to B.
Till now B hasn't got any plot in Third column and 2nd row.
So, Y3 belongs to B and Y2, Y4, Z3 belongs to A.
Let the number of trees in Y4 be 4x from 3, number of trees in Y3, Y2 will be 2x, x respectively.
The number of teak trees=7x+21
.'. Number of mango trees=14x+42
The table now looks like:
Each plot had trees in non-zero multiples of 3 or 4 and none of the plots had the same number of trees and from 2, B didn't have the largest number of trees in a plot => x<8.
x can't be 7,5,3,2,1 as for these cases at least one of x,2x,4x is neither multiple of 3 or 4.
x can be 6 or 4.
If x=6, number of Teak trees will be 63 and Mango trees will be 126 => Number of Pine trees= 205-126-63=16 but number of trees in Z3+Z4>16 so, x$$\ne\ $$6.
If x=4, Number of Teak trees=49 and Mango trees=98 => Number of Pine trees=58. Valid case.
Number of trees with A= 30+5x=50.
From 1, number of trees with C, D= 30, 56 respectively.
So, number of trees in Z2= 18.
.'. Number of trees with B= 205-50-30-56=69.
From 2, largest number of trees in a plot is 32. They can be in the plot of either B or D. If they are from B, they have to be from X2 but in that case number of trees in Z1=1 which is neither a multiple of 3 or 4.
So, highest number of trees in a plot are with D and it is 32 -=> number of trees in X3, X4 are 32, 24 in any order.
So, number of trees in X2= 98-56-12=30
.'. Number of trees in Z1=69-30-28-8=3.
The final table will look like:
Sequence of trees received by Abha, Bina, Chitra and Dipti is 50,69,30,56.
How many pine trees did Chitra receive?
There are 12 plots and each of them got even number of plots. So, possible cases are 4,4,2,2 or 6,2,2,2.
From 4, A and B got more plots than D. So, the only possible case is A, B each got 4 and C,D each got 2.
From 6, D has to get two adjacent plots and From 8, plots of C, D are nit adjacent to each other => D must have got plots in X3, X4.
C already has two plots in X1, Z2. So, the corner plot Z4 should belong to B.
From 7, B has a plot in each row and each column. So, X2 should belong to B.
Now, out of the remaining Y2, Y3, Y4 and Z3 three plots belong to A and one belongs to B.
Till now B hasn't got any plot in Third column and 2nd row.
So, Y3 belongs to B and Y2, Y4, Z3 belongs to A.
Let the number of trees in Y4 be 4x from 3, number of trees in Y3, Y2 will be 2x, x respectively.
The number of teak trees=7x+21
.'. Number of mango trees=14x+42
The table now looks like:
Each plot had trees in non-zero multiples of 3 or 4 and none of the plots had the same number of trees and from 2, B didn't have the largest number of trees in a plot => x<8.
x can't be 7,5,3,2,1 as for these cases at least one of x,2x,4x is neither multiple of 3 or 4.
x can be 6 or 4.
If x=6, number of Teak trees will be 63 and Mango trees will be 126 => Number of Pine trees= 205-126-63=16 but number of trees in Z3+Z4>16 so, x$$\ne\ $$6.
If x=4, Number of Teak trees=49 and Mango trees=98 => Number of Pine trees=58. Valid case.
Number of trees with A= 30+5x=50.
From 1, number of trees with C, D= 30, 56 respectively.
So, number of trees in Z2= 18.
.'. Number of trees with B= 205-50-30-56=69.
From 2, largest number of trees in a plot is 32. They can be in the plot of either B or D. If they are from B, they have to be from X2 but in that case number of trees in Z1=1 which is neither a multiple of 3 or 4.
So, highest number of trees in a plot are with D and it is 32 -=> number of trees in X3, X4 are 32, 24 in any order.
So, number of trees in X2= 98-56-12=30
.'. Number of trees in Z1=69-30-28-8=3.
The final table will look like:
Number of PIne trees received by Chitra = 18.
Who got the plot with the smallest number of trees and how many trees did that plot have?
There are 12 plots and each of them got even number of plots. So, possible cases are 4,4,2,2 or 6,2,2,2.
From 4, A and B got more plots than D. So, the only possible case is A, B each got 4 and C,D each got 2.
From 6, D has to get two adjacent plots and From 8, plots of C, D are nit adjacent to each other => D must have got plots in X3, X4.
C already has two plots in X1, Z2. So, the corner plot Z4 should belong to B.
From 7, B has a plot in each row and each column. So, X2 should belong to B.
Now, out of the remaining Y2, Y3, Y4 and Z3 three plots belong to A and one belongs to B.
Till now B hasn't got any plot in Third column and 2nd row.
So, Y3 belongs to B and Y2, Y4, Z3 belongs to A.
Let the number of trees in Y4 be 4x from 3, number of trees in Y3, Y2 will be 2x, x respectively.
The number of teak trees=7x+21
.'. Number of mango trees=14x+42
The table now looks like:
Each plot had trees in non-zero multiples of 3 or 4 and none of the plots had the same number of trees and from 2, B didn't have the largest number of trees in a plot => x<8.
x can't be 7,5,3,2,1 as for these cases at least one of x,2x,4x is neither multiple of 3 or 4.
x can be 6 or 4.
If x=6, number of Teak trees will be 63 and Mango trees will be 126 => Number of Pine trees= 205-126-63=16 but number of trees in Z3+Z4>16 so, x$$\ne\ $$6.
If x=4, Number of Teak trees=49 and Mango trees=98 => Number of Pine trees=58. Valid case.
Number of trees with A= 30+5x=50.
From 1, number of trees with C, D= 30, 56 respectively.
So, number of trees in Z2= 18.
.'. Number of trees with B= 205-50-30-56=69.
From 2, largest number of trees in a plot is 32. They can be in the plot of either B or D. If they are from B, they have to be from X2 but in that case number of trees in Z1=1 which is neither a multiple of 3 or 4.
So, highest number of trees in a plot are with D and it is 32 -=> number of trees in X3, X4 are 32, 24 in any order.
So, number of trees in X2= 98-56-12=30
.'. Number of trees in Z1=69-30-28-8=3.
The final table will look like:
.'. Number of trees per plot is least for Benna=3.
Which of the following statements is NOT true?
There are 12 plots and each of them got even number of plots. So, possible cases are 4,4,2,2 or 6,2,2,2.
From 4, A and B got more plots than D. So, the only possible case is A, B each got 4 and C,D each got 2.
From 6, D has to get two adjacent plots and From 8, plots of C, D are nit adjacent to each other => D must have got plots in X3, X4.
C already has two plots in X1, Z2. So, the corner plot Z4 should belong to B.
From 7, B has a plot in each row and each column. So, X2 should belong to B.
Now, out of the remaining Y2, Y3, Y4 and Z3 three plots belong to A and one belongs to B.
Till now B hasn't got any plot in Third column and 2nd row.
So, Y3 belongs to B and Y2, Y4, Z3 belongs to A.
Let the number of trees in Y4 be 4x from 3, number of trees in Y3, Y2 will be 2x, x respectively.
The number of teak trees=7x+21
.'. Number of mango trees=14x+42
The table now looks like:
Each plot had trees in non-zero multiples of 3 or 4 and none of the plots had the same number of trees and from 2, B didn't have the largest number of trees in a plot => x<8.
x can't be 7,5,3,2,1 as for these cases at least one of x,2x,4x is neither multiple of 3 or 4.
x can be 6 or 4.
If x=6, number of Teak trees will be 63 and Mango trees will be 126 => Number of Pine trees= 205-126-63=16 but number of trees in Z3+Z4>16 so, x$$\ne\ $$6.
If x=4, Number of Teak trees=49 and Mango trees=98 => Number of Pine trees=58. Valid case.
Number of trees with A= 30+5x=50.
From 1, number of trees with C, D= 30, 56 respectively.
So, number of trees in Z2= 18.
.'. Number of trees with B= 205-50-30-56=69.
From 2, largest number of trees in a plot is 32. They can be in the plot of either B or D. If they are from B, they have to be from X2 but in that case number of trees in Z1=1 which is neither a multiple of 3 or 4.
So, highest number of trees in a plot are with D and it is 32 -=> number of trees in X3, X4 are 32, 24 in any order.
So, number of trees in X2= 98-56-12=30
.'. Number of trees in Z1=69-30-28-8=3.
The final table will look like:
Bina got 28 pine trees, Option B is correct answer.
Which column had the highest number of trees?
There are 12 plots and each of them got even number of plots. So, possible cases are 4,4,2,2 or 6,2,2,2.
From 4, A and B got more plots than D. So, the only possible case is A, B each got 4 and C,D each got 2.
From 6, D has to get two adjacent plots and From 8, plots of C, D are nit adjacent to each other => D must have got plots in X3, X4.
C already has two plots in X1, Z2. So, the corner plot Z4 should belong to B.
From 7, B has a plot in each row and each column. So, X2 should belong to B.
Now, out of the remaining Y2, Y3, Y4 and Z3 three plots belong to A and one belongs to B.
Till now B hasn't got any plot in Third column and 2nd row.
So, Y3 belongs to B and Y2, Y4, Z3 belongs to A.
Let the number of trees in Y4 be 4x from 3, number of trees in Y3, Y2 will be 2x, x respectively.
The number of teak trees=7x+21
.'. Number of mango trees=14x+42
The table now looks like:
Each plot had trees in non-zero multiples of 3 or 4 and none of the plots had the same number of trees and from 2, B didn't have the largest number of trees in a plot => x<8.
x can't be 7,5,3,2,1 as for these cases at least one of x,2x,4x is neither multiple of 3 or 4.
x can be 6 or 4.
If x=6, number of Teak trees will be 63 and Mango trees will be 126 => Number of Pine trees= 205-126-63=16 but number of trees in Z3+Z4>16 so, x$$\ne\ $$6.
If x=4, Number of Teak trees=49 and Mango trees=98 => Number of Pine trees=58. Valid case.
Number of trees with A= 30+5x=50.
From 1, number of trees with C, D= 30, 56 respectively.
So, number of trees in Z2= 18.
.'. Number of trees with B= 205-50-30-56=69.
From 2, largest number of trees in a plot is 32. They can be in the plot of either B or D. If they are from B, they have to be from X2 but in that case number of trees in Z1=1 which is neither a multiple of 3 or 4.
So, highest number of trees in a plot are with D and it is 32 -=> number of trees in X3, X4 are 32, 24 in any order.
So, number of trees in X2= 98-56-12=30
.'. Number of trees in Z1=69-30-28-8=3.
The final table will look like:
Column 1,2,3,4 have 36, 52, 49, 68 trees respectively.
Hence A is correct answer.
The Hi-Lo game is a four-player game played in six rounds. In every round, each player chooses to bid Hi or Lo. The bids are made simultaneously. If all four bid Hi, then all four lose 1 point each. If three players bid Hi and one bids Lo, then the players bidding Hi gain 1 point each and the player bidding Lo loses 3 points. If two players bid Hi and two bid Lo, then the players bidding Hi gain 2 points each and the players bidding Lo lose 2 points each. If one player bids Hi and three bid Lo, then the player bidding Hi gains 3 points and the players bidding Lo lose 1 point each. If all four bid Lo, then all four gain 1 point each. Four players Arun, Bankim, Charu, and Dipak played the Hi-Lo game. The following facts are known about their game:
1. At the end of three rounds, Arun had scored 6 points, Dipak had scored 2 points, Bankim and Charu had scored -2 points each.
2. At the end of six rounds, Arun had scored 7 points, Bankim and Dipak had scored -1 point each, and Charu had scored -5 points.
3. Dipak’s score in the third round was less than his score in the first round but was more than his score in the second round.
4. In exactly two out of the six rounds, Arun was the only player who bid Hi.
What were the bids by Arun, Bankim, Charu and Dipak, respectively in the first round?
Let 'H' represents Hi and 'L' represents Lo.
Given if they bid
Case 1: HHHH then all players gets -1 points.
Case 2: HHHL => H gets +1 and L gets -3.
Case 3: HHLL => H gets +2 and L gets -2.
Case 4: HLLL => H gets +3 and L gets -1.
Case 5: LLLL => every player gets +1.
From the given information we can draw the following table:
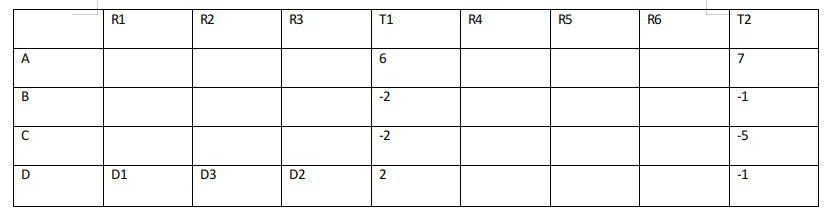
**T1 is the cumulative of points till Round 3 and T2 is sum of points till round 6.
**Arun, Bankim, Charu, and Dipak are represented by A, B, C, D respectively.
From point 3, D1>D2>D3
D scored 2 points till round R3 and D1>D3>D2 the possible scenarios are :
Case D1: 3,2,-3
In this case the points of A in R1, R3, R2 will be -1,2/-2, 1 in any possible combination the sum will not be 6. So, this case is invalid.
Case D2: 2,1,-1
In this case the points of A in R1, R3, R2 will be 2/-2, 1/-3, -1/3 so, if the points in R1, R3, R2 are 2,1,3 the case is valid and no other cases are possible.
Case D3: 3,1,-2
In this case the points of A in R1, R3, R2 will be -1, 1/-3/1, 2/-2
in any possible combination the sum will not be 6. So, this case is
invalid.
.'. Points of A,D in (R1,R2,R3) are (2,3,1) and (2,-1,1) respectively.
Since A got +3 in R2, he is only the one to bid h in R2 and points of B and C in round 2 are -1,-1 i.e they bid L, L.
Since A and D got 2 points each in R1, C and B must have got -2, -2 i.e they bid L, L.
Since A and D got 1 point in R3, C and B must also have got 1 in R3 i.e they bid L, L.
With this data, the table now looks like:
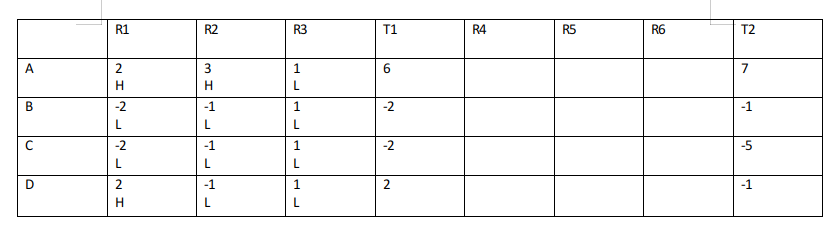
No information is given about the individual scores in R4, R5, R6.
Given In exactly two out of the six rounds, Arun was the only player who bid Hi.
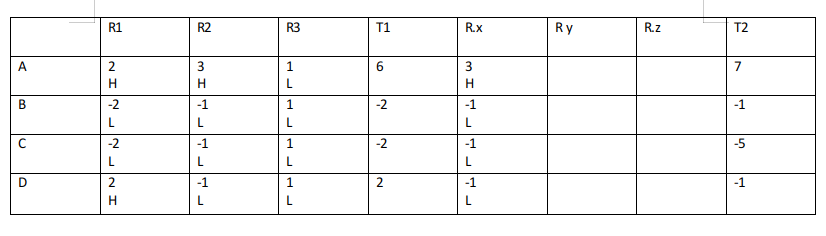
Let R.x, R.y, R.z represent R4, R5, R6 in any order.
Let A bid H in R.x=> B,C,D bid L.
The table now looks like:
For A, R.x+R.y+R.z=1 => R.y+R.z=-2
For B, R.x+R.y+R.z=1 => R.y+R.z=2
For C, R.x+R.y+R.z=-3 => R.y+R.z=-2
For D, R.x+R.y+R.z=-3.=> R.y+R.z=-2
(R.y, R.z) for A can be (-3,1) or (-1,-1)
Case A1:
If for A, (R.y, R.z)=(-3,1)
Since for both C,D: R.y+R.z=-2
We can't get any combination such that the total points of B,C,D are obtained.
Case A2:
If for A, (R.y, R.z)=(-1,-1).the (R.y, R.z) of B,C,D can be (3,-1), (-1,-1), (-1,-1) and they must have bid (H,H), (L,H), (L,H) respectively while A must have bid (L, H)
Hence this case is valid.
The final table looks like:
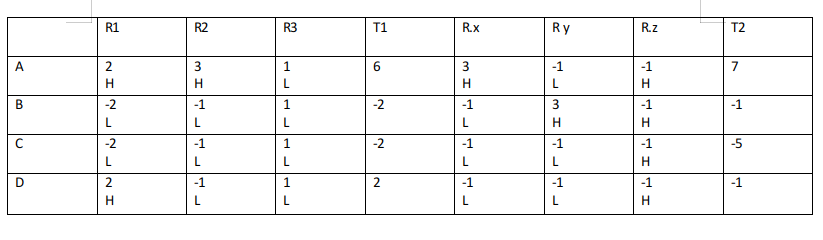
The bids by Arun, Bankim, Charu and Dipak, respectively in the first round are HLLH.
Hence Option A is correct.
In how many rounds did Arun bid Hi?
Let 'H' represents Hi and 'L' represents Lo.
Given if they bid
Case 1: HHHH then all players gets -1 points.
Case 2: HHHL => H gets +1 and L gets -3.
Case 3: HHLL => H gets +2 and L gets -2.
Case 4: HLLL => H gets +3 and L gets -1.
Case 5: LLLL => every player gets +1.
From the given information we can draw the following table:
**T1 is the cumulative of points till Round 3 and T2 is sum of points till round 6.
**Arun, Bankim, Charu, and Dipak are represented by A, B, C, D respectively.
From point 3, D1>D2>D3
D scored 2 points till round R3 and D1>D3>D2 the possible scenarios are :
Case D1: 3,2,-3
In this case the points of A in R1, R3, R2 will be -1,2/-2, 1 in any possible combination the sum will not be 6. So, this case is invalid.
Case D2: 2,1,-1
In this case the points of A in R1, R3, R2 will be 2/-2, 1/-3, -1/3 so, if the points in R1, R3, R2 are 2,1,3 the case is valid and no other cases are possible.
Case D3: 3,1,-2
In this case the points of A in R1, R3, R2 will be -1, 1/-3/1, 2/-2
in any possible combination the sum will not be 6. So, this case is
invalid.
.'. Points of A,D in (R1,R2,R3) are (2,3,1) and (2,-1,1) respectively.
Since A got +3 in R2, he is only the one to bid h in R2 and points of B and C in round 2 are -1,-1 i.e they bid L, L.
Since A and D got 2 points each in R1, C and B must have got -2, -2 i.e they bid L, L.
Since A and D got 1 point in R3, C and B must also have got 1 in R3 i.e they bid L, L.
With this data, the table now looks like:
No information is given about the individual scores in R4, R5, R6.
Given In exactly two out of the six rounds, Arun was the only player who bid Hi.
Let R.x, R.y, R.z represent R4, R5, R6 in any order.
Let A bid H in R.x=> B,C,D bid L.
The table now looks like:
For A, R.x+R.y+R.z=1 => R.y+R.z=-2
For B, R.x+R.y+R.z=1 => R.y+R.z=2
For C, R.x+R.y+R.z=-3 => R.y+R.z=-2
For D, R.x+R.y+R.z=-3.=> R.y+R.z=-2
(R.y, R.z) for A can be (-3,1) or (-1,-1)
Case A1:
If for A, (R.y, R.z)=(-3,1)
Since for both C,D: R.y+R.z=-2
We can't get any combination such that the total points of B,C,D are obtained.
Case A2:
If for A, (R.y, R.z)=(-1,-1).the (R.y, R.z) of B,C,D can be (3,-1), (-1,-1), (-1,-1) and they must have bid (H,H), (L,H), (L,H) respectively while A must have bid (L, H)
Hence this case is valid.
The final table looks like:
Arun bid high in R1,R2, R.x, R.z hence, 4 is correct answer.
In how many rounds did Bankim bid Lo?
Let 'H' represents Hi and 'L' represents Lo.
Given if they bid
Case 1: HHHH then all players gets -1 points.
Case 2: HHHL => H gets +1 and L gets -3.
Case 3: HHLL => H gets +2 and L gets -2.
Case 4: HLLL => H gets +3 and L gets -1.
Case 5: LLLL => every player gets +1.
From the given information we can draw the following table:
**T1 is the cumulative of points till Round 3 and T2 is sum of points till round 6.
**Arun, Bankim, Charu, and Dipak are represented by A, B, C, D respectively.
From point 3, D1>D2>D3
D scored 2 points till round R3 and D1>D3>D2 the possible scenarios are :
Case D1: 3,2,-3
In this case the points of A in R1, R3, R2 will be -1,2/-2, 1 in any possible combination the sum will not be 6. So, this case is invalid.
Case D2: 2,1,-1
In this case the points of A in R1, R3, R2 will be 2/-2, 1/-3, -1/3 so, if the points in R1, R3, R2 are 2,1,3 the case is valid and no other cases are possible.
Case D3: 3,1,-2
In this case the points of A in R1, R3, R2 will be -1, 1/-3/1, 2/-2
in any possible combination the sum will not be 6. So, this case is
invalid.
.'. Points of A,D in (R1,R2,R3) are (2,3,1) and (2,-1,1) respectively.
Since A got +3 in R2, he is only the one to bid h in R2 and points of B and C in round 2 are -1,-1 i.e they bid L, L.
Since A and D got 2 points each in R1, C and B must have got -2, -2 i.e they bid L, L.
Since A and D got 1 point in R3, C and B must also have got 1 in R3 i.e they bid L, L.
With this data, the table now looks like:
No information is given about the individual scores in R4, R5, R6.
Given In exactly two out of the six rounds, Arun was the only player who bid Hi.
Let R.x, R.y, R.z represent R4, R5, R6 in any order.
Let A bid H in R.x=> B,C,D bid L.
The table now looks like:
For A, R.x+R.y+R.z=1 => R.y+R.z=-2
For B, R.x+R.y+R.z=1 => R.y+R.z=2
For C, R.x+R.y+R.z=-3 => R.y+R.z=-2
For D, R.x+R.y+R.z=-3.=> R.y+R.z=-2
(R.y, R.z) for A can be (-3,1) or (-1,-1)
Case A1:
If for A, (R.y, R.z)=(-3,1)
Since for both C,D: R.y+R.z=-2
We can't get any combination such that the total points of B,C,D are obtained.
Case A2:
If for A, (R.y, R.z)=(-1,-1).the (R.y, R.z) of B,C,D can be (3,-1), (-1,-1), (-1,-1) and they must have bid (H,H), (L,H), (L,H) respectively while A must have bid (L, H)
Hence this case is valid.
The final table looks like:
Bikram bid Lo in R1,R2,R3,R.x. Hence 4 is correct answer.
In how many rounds did all four players make identical bids?
Let 'H' represents Hi and 'L' represents Lo.
Given if they bid
Case 1: HHHH then all players gets -1 points.
Case 2: HHHL => H gets +1 and L gets -3.
Case 3: HHLL => H gets +2 and L gets -2.
Case 4: HLLL => H gets +3 and L gets -1.
Case 5: LLLL => every player gets +1.
From the given information we can draw the following table:
**T1 is the cumulative of points till Round 3 and T2 is sum of points till round 6.
**Arun, Bankim, Charu, and Dipak are represented by A, B, C, D respectively.
From point 3, D1>D2>D3
D scored 2 points till round R3 and D1>D3>D2 the possible scenarios are :
Case D1: 3,2,-3
In this case the points of A in R1, R3, R2 will be -1,2/-2, 1 in any possible combination the sum will not be 6. So, this case is invalid.
Case D2: 2,1,-1
In this case the points of A in R1, R3, R2 will be 2/-2, 1/-3, -1/3 so, if the points in R1, R3, R2 are 2,1,3 the case is valid and no other cases are possible.
Case D3: 3,1,-2
In this case the points of A in R1, R3, R2 will be -1, 1/-3/1, 2/-2
in any possible combination the sum will not be 6. So, this case is
invalid.
.'. Points of A,D in (R1,R2,R3) are (2,3,1) and (2,-1,1) respectively.
Since A got +3 in R2, he is only the one to bid h in R2 and points of B and C in round 2 are -1,-1 i.e they bid L, L.
Since A and D got 2 points each in R1, C and B must have got -2, -2 i.e they bid L, L.
Since A and D got 1 point in R3, C and B must also have got 1 in R3 i.e they bid L, L.
With this data, the table now looks like:
No information is given about the individual scores in R4, R5, R6.
Given In exactly two out of the six rounds, Arun was the only player who bid Hi.
Let R.x, R.y, R.z represent R4, R5, R6 in any order.
Let A bid H in R.x=> B,C,D bid L.
The table now looks like:
For A, R.x+R.y+R.z=1 => R.y+R.z=-2
For B, R.x+R.y+R.z=1 => R.y+R.z=2
For C, R.x+R.y+R.z=-3 => R.y+R.z=-2
For D, R.x+R.y+R.z=-3.=> R.y+R.z=-2
(R.y, R.z) for A can be (-3,1) or (-1,-1)
Case A1:
If for A, (R.y, R.z)=(-3,1)
Since for both C,D: R.y+R.z=-2
We can't get any combination such that the total points of B,C,D are obtained.
Case A2:
If for A, (R.y, R.z)=(-1,-1).the (R.y, R.z) of B,C,D can be (3,-1), (-1,-1), (-1,-1) and they must have bid (H,H), (L,H), (L,H) respectively while A must have bid (L, H)
Hence this case is valid.
The final table looks like:
All the players made identical bids in R3 and R.z
In how many rounds did Dipak gain exactly 1 point?
Let 'H' represents Hi and 'L' represents Lo.
Given if they bid
Case 1: HHHH then all players gets -1 points.
Case 2: HHHL => H gets +1 and L gets -3.
Case 3: HHLL => H gets +2 and L gets -2.
Case 4: HLLL => H gets +3 and L gets -1.
Case 5: LLLL => every player gets +1.
From the given information we can draw the following table:
**T1 is the cumulative of points till Round 3 and T2 is sum of points till round 6.
**Arun, Bankim, Charu, and Dipak are represented by A, B, C, D respectively.
From point 3, D1>D2>D3
D scored 2 points till round R3 and D1>D3>D2 the possible scenarios are :
Case D1: 3,2,-3
In this case the points of A in R1, R3, R2 will be -1,2/-2, 1 in any possible combination the sum will not be 6. So, this case is invalid.
Case D2: 2,1,-1
In this case the points of A in R1, R3, R2 will be 2/-2, 1/-3, -1/3 so, if the points in R1, R3, R2 are 2,1,3 the case is valid and no other cases are possible.
Case D3: 3,1,-2
In this case the points of A in R1, R3, R2 will be -1, 1/-3/1, 2/-2
in any possible combination the sum will not be 6. So, this case is
invalid.
.'. Points of A,D in (R1,R2,R3) are (2,3,1) and (2,-1,1) respectively.
Since A got +3 in R2, he is only the one to bid h in R2 and points of B and C in round 2 are -1,-1 i.e they bid L, L.
Since A and D got 2 points each in R1, C and B must have got -2, -2 i.e they bid L, L.
Since A and D got 1 point in R3, C and B must also have got 1 in R3 i.e they bid L, L.
With this data, the table now looks like:
No information is given about the individual scores in R4, R5, R6.
Given In exactly two out of the six rounds, Arun was the only player who bid Hi.
Let R.x, R.y, R.z represent R4, R5, R6 in any order.
Let A bid H in R.x=> B,C,D bid L.
The table now looks like:
For A, R.x+R.y+R.z=1 => R.y+R.z=-2
For B, R.x+R.y+R.z=1 => R.y+R.z=2
For C, R.x+R.y+R.z=-3 => R.y+R.z=-2
For D, R.x+R.y+R.z=-3.=> R.y+R.z=-2
(R.y, R.z) for A can be (-3,1) or (-1,-1)
Case A1:
If for A, (R.y, R.z)=(-3,1)
Since for both C,D: R.y+R.z=-2
We can't get any combination such that the total points of B,C,D are obtained.
Case A2:
If for A, (R.y, R.z)=(-1,-1).the (R.y, R.z) of B,C,D can be (3,-1), (-1,-1), (-1,-1) and they must have bid (H,H), (L,H), (L,H) respectively while A must have bid (L, H)
Hence this case is valid.
The final table looks like:
Deepak got exactly one point in only R3.
Hence 1 is correct answer.
In which of the following rounds, was Arun DEFINITELY the only player to bid Hi?
Let 'H' represents Hi and 'L' represents Lo.
Given if they bid
Case 1: HHHH then all players gets -1 points.
Case 2: HHHL => H gets +1 and L gets -3.
Case 3: HHLL => H gets +2 and L gets -2.
Case 4: HLLL => H gets +3 and L gets -1.
Case 5: LLLL => every player gets +1.
From the given information we can draw the following table:
**T1 is the cumulative of points till Round 3 and T2 is sum of points till round 6.
**Arun, Bankim, Charu, and Dipak are represented by A, B, C, D respectively.
From point 3, D1>D2>D3
D scored 2 points till round R3 and D1>D3>D2 the possible scenarios are :
Case D1: 3,2,-3
In this case the points of A in R1, R3, R2 will be -1,2/-2, 1 in any possible combination the sum will not be 6. So, this case is invalid.
Case D2: 2,1,-1
In this case the points of A in R1, R3, R2 will be 2/-2, 1/-3, -1/3 so, if the points in R1, R3, R2 are 2,1,3 the case is valid and no other cases are possible.
Case D3: 3,1,-2
In this case the points of A in R1, R3, R2 will be -1, 1/-3/1, 2/-2
in any possible combination the sum will not be 6. So, this case is
invalid.
.'. Points of A,D in (R1,R2,R3) are (2,3,1) and (2,-1,1) respectively.
Since A got +3 in R2, he is only the one to bid h in R2 and points of B and C in round 2 are -1,-1 i.e they bid L, L.
Since A and D got 2 points each in R1, C and B must have got -2, -2 i.e they bid L, L.
Since A and D got 1 point in R3, C and B must also have got 1 in R3 i.e they bid L, L.
With this data, the table now looks like:
No information is given about the individual scores in R4, R5, R6.
Given In exactly two out of the six rounds, Arun was the only player who bid Hi.
Let R.x, R.y, R.z represent R4, R5, R6 in any order.
Let A bid H in R.x=> B,C,D bid L.
The table now looks like:
For A, R.x+R.y+R.z=1 => R.y+R.z=-2
For B, R.x+R.y+R.z=1 => R.y+R.z=2
For C, R.x+R.y+R.z=-3 => R.y+R.z=-2
For D, R.x+R.y+R.z=-3.=> R.y+R.z=-2
(R.y, R.z) for A can be (-3,1) or (-1,-1)
Case A1:
If for A, (R.y, R.z)=(-3,1)
Since for both C,D: R.y+R.z=-2
We can't get any combination such that the total points of B,C,D are obtained.
Case A2:
If for A, (R.y, R.z)=(-1,-1).the (R.y, R.z) of B,C,D can be (3,-1), (-1,-1), (-1,-1) and they must have bid (H,H), (L,H), (L,H) respectively while A must have bid (L, H)
Hence this case is valid.
The final table looks like:
R2 is correct answer.
A survey of 600 schools in India was conducted to gather information about their online teaching learning processes (OTLP). The following four facilities were studied.
F1: Own software for OTLP
F2: Trained teachers for OTLP
F3: Training materials for OTLP
F4: All students having Laptops
The following observations were summarized from the survey.
1. 80 schools did not have any of the four facilities - F1, F2, F3, F4.
2. 40 schools had all four facilities.
3. The number of schools with only F1, only F2, only F3, and only F4 was 25, 30, 26 and 20 respectively.
4. The number of schools with exactly three of the facilities was the same irrespective of which three were considered.
5. 313 schools had F2.
6. 26 schools had only F2 and F3 (but neither F1 nor F4).
7. Among the schools having F4, 24 had only F3, and 45 had only F2.
8. 162 schools had both F1 and F2.
9. The number of schools having F1 was the same as the number of schools having F4.
What was the total number of schools having exactly three of the four facilities?
Let the number of schools with exactly three of the facilities was the same irrespective of which three were considered be x.
Number of schools with none of the facilities be 'n' from 1, n=80.
Number of schools with only F1 and F2 be 'b'
Number of schools with only F1 and F3 be 'c'
Number of schools with only F1 and F4 be 'd'
From the information given in the question we will get the following Venn diagram.
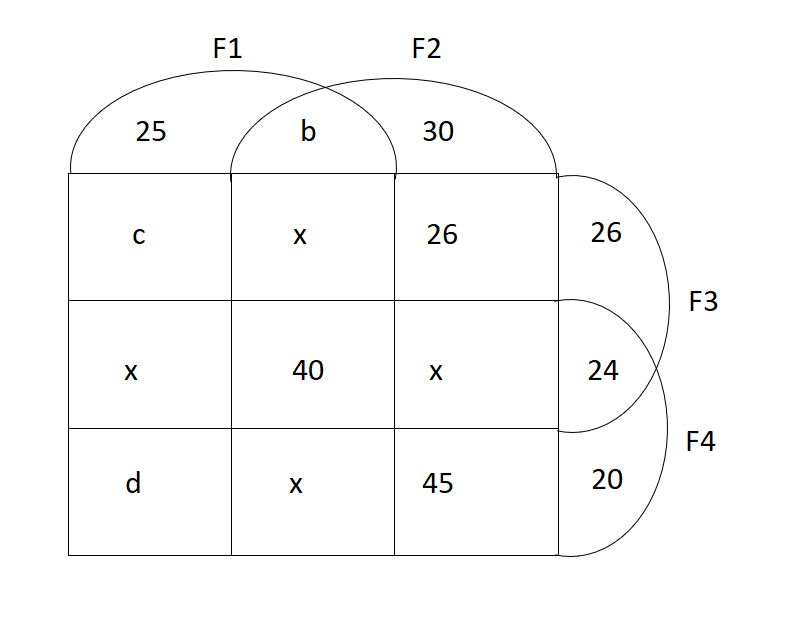
From 5, b+141+3x=313 => b+3x=172....(i)
From 8, b+x+40+x=162 => b+2x=122....(ii)
(ii)-(i) gives x=50 => b=22
From 9, 237+3x+c+d=279+3x=d => c=42
Total number of schools =600 => 313+25+c+x+d+26+24+20+80=600 => d=20.
The final table looks like:
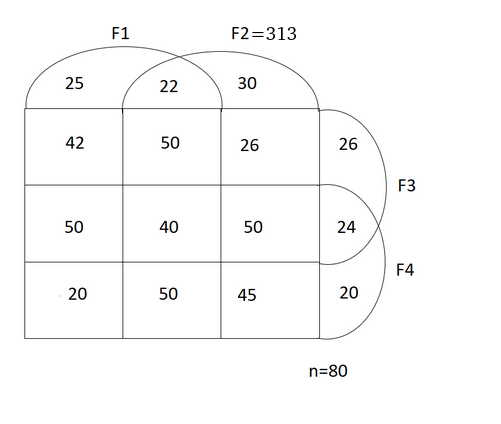
The total number of schools with exactly three of the four facilities= 4x=200.
What was the number of schools having facilities F2 and F4?
Let the number of schools with exactly three of the facilities was the same irrespective of which three were considered be x.
Number of schools with none of the facilities be 'n' from 1, n=80.
Number of schools with only F1 and F2 be 'b'
Number of schools with only F1 and F3 be 'c'
Number of schools with only F1 and F4 be 'd'
From the information given in the question we will get the following Venn diagram.
From 5, b+141+3x=313 => b+3x=172....(i)
From 8, b+x+40+x=162 => b+2x=122....(ii)
(ii)-(i) gives x=50 => b=22
From 9, 237+3x+c+d=279+3x=d => c=42
Total number of schools =600 => 313+25+c+x+d+26+24+20+80=600 => d=20.
The final table looks like:
The total number of schools having facilities F4 and F2= 45+50+50+40=185.
What was the number of schools having only facilities F1 and F3?
Let the number of schools with exactly three of the facilities was the same irrespective of which three were considered be x.
Number of schools with none of the facilities be 'n' from 1, n=80.
Number of schools with only F1 and F2 be 'b'
Number of schools with only F1 and F3 be 'c'
Number of schools with only F1 and F4 be 'd'
From the information given in the question we will get the following Venn diagram.
From 5, b+141+3x=313 => b+3x=172....(i)
From 8, b+x+40+x=162 => b+2x=122....(ii)
(ii)-(i) gives x=50 => b=22
From 9, 237+3x+c+d=279+3x=d => c=42
Total number of schools =600 => 313+25+c+x+d+26+24+20+80=600 => d=20.
The final table looks like:
The total number of schools having only F1 and F3= c=42
What was the number of schools having only facilities F1 and F4?
Let the number of schools with exactly three of the facilities was the same irrespective of which three were considered be x.
Number of schools with none of the facilities be 'n' from 1, n=80.
Number of schools with only F1 and F2 be 'b'
Number of schools with only F1 and F3 be 'c'
Number of schools with only F1 and F4 be 'd'
From the information given in the question we will get the following Venn diagram.
From 5, b+141+3x=313 => b+3x=172....(i)
From 8, b+x+40+x=162 => b+2x=122....(ii)
(ii)-(i) gives x=50 => b=22
From 9, 237+3x+c+d=279+3x=d => c=42
Total number of schools =600 => 313+25+c+x+d+26+24+20+80=600 => d=20.
The final table looks like:
The total number of schools having only F1 and F4=20.

Educational materials for CAT preparation
 Share
Share
