SSC CHSL Data Interpretation Questions:
Download Top-20 Data Interpretation questions for SSC CHSL exam. Most important Data Interpretation Questions based on asked questions in previous exam papers for SSC CHSL.
Download Top-20 SSC CHSL Data Interpretation Questions
Get 25 SSC CHSL Mocks – Just Rs. 149
Take a free SSC CHSL Tier-1 mock test
Download SSC CHSL Previous Papers PDF
InstructionsDirections :The pie chart, given here, represents the number of valid votes obtained by four students who contested election for school leadership. The total number of valid votes polled was 720. Observe the chart and answer the questions based on it.

Number represented in pie-chart are in degrees.
Question 1: What was the winner ?
a) Sivaraman
b) Paramjeet
c) Yasin
d) Vishwanath
InstructionsDirections : The following graph shows the production of cotton bales of 100 kg each in lakhs by different states A, B, C, D and E over the years. Study the graph and answer the following Questions.

Question 2: In which State(s) is there a steady increase in the production of cotton during the given period?
a) A and B
b) B and D
c) A and C
d) D and E
Question 3: How many kg of cotton was produced by State C during the given period?
a) 32,00,00,000 kg
b) 42,50,00,000 kg
c) 33,00,00,000 kg
d) 35,00,00,000 kg
Question 4: The number of States for which the production of cotton in 2005-2006 is less than or equal to the preceding year is
a) 3
b) 2
c) 1
d) There is no such States
Instructions
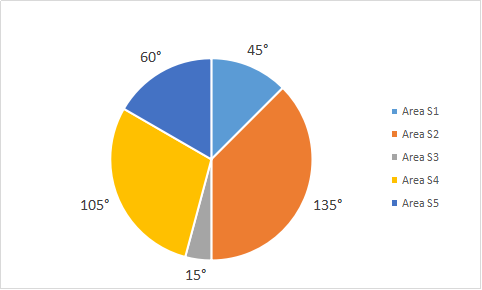
Directions : Population of the five adjacent areas of a town, in the year of 2020, are represented in the following Pie-chart. The ratio of the numbers of males to that of females in these areas are states in the table below. The total of the population in all the five areas is 72 lakh. Study the Pie-chart and the table and then answer the questions.

Ratio of number of males(M) to females(F)
Question 5: 12 lakh in the population of the area
a) S1
b) S3
c) S5
d) S4
Question 6: The number of males in the areas S1 and S4 together is
a) 13.8 lakh
b) 8.2 lakh
c) 16.2 lakh
d) 15.8 lakh
Instructions
Study the following Histogram and answer the following questions.
Question 7: The total number of students involved in the data is
a) 33
b) 32
c) 43
d) 42
Question 8: The maximum number of students got the marks in the interval of
a) 10-20
b) 20-30
c) 30-40
d) 40-50
Instructions
The pie-chart shows the proposed outlay for different sectors during a Five-Year plan of Government of India. Total outlay is Rs. 40,000 crores. By reading the pie-chart answer the following three questions.
Question 9: If the proposed outlay of Irrigation is x% of the proposed outlay of Agriculture, then x is equal to
a) 50%
b) 15%
c) 25%
d) 75%
Question 10: What is the ratio between the proposed outlay of Irrigation and Communication?
a) 9 : 8
b) 3 : 2
c) 9 : 5
d) 6 : 5
Instructions
Study the following bar diagram carefully and answer the following questions.
The number of the production of electronic items (TVs and LCDs) in a factory during the period from 2009 to 2013.
Join Exam Preparation Telegram Group
Question 11: The total number of products of electronic items is maximum in the year
a) 2009
b) 2010
c) 2011
d) 2013
Question 12: The ratio of production of LCDs in the year 2011 and 2013 is
a) 3 : 4
b) 4 : 3
c) 2 : 3
d) 1 : 4
Question 13: The difference between averages of production of TVs and LCDs from 2009 to 2012 is
a) 600
b) 700
c) 800
d) 900
Question 14: The ratio of production of TVs in the years 2009 and 2010 is
a) 7 : 6
b) 6 : 7
c) 2 : 3
d) 3 : 2
Instructions
The following pie-chart shows the sources of funds (InRs. crores) to be collected by the National Highways Authority of India (NHAI) for its Phase II projects. Study the pie-chart and answer the following Three questions
Question 15: If the toll is to be collected through an outsourced agency by allowing a maximum 10% commission, how much amount should be permitted to be collected by the outsourced agency, so that the project is supported with Rs. 4,910 crores ?
a) Rs. 6,213 crores
b) Rs. 5,827 crores
c) Rs. 5,401 crores
d) Rs. 5,316 crores
Get 25 SSC CHSL Mocks – Just Rs. 149
Question 16: If NHAI could receive a total of Rs. 9,695 crores as External Assistance, by what percent (approximately) should it increase the Market Borrowing to arrange for the shortage of funds ?
a) 4.5%
b) 7.5%
c) 6%
d) 8%
Instructions
Study the following frequency polygon and answer the questions. Given a line graph showing the number of students passed in Higher Secondary Examination in a school over the years 2008 to 2013.
Question 17: The average of passed students in the years 2008, 2009, 2012 approximately is
a) 134.32
b) 134.41
c) 134.56
d) 134.67
Question 18: The increase in percentage of passed students from 2008 to 2011 approximately is
a) 55%
b) 50.5%
c) 54.5%
d) 53.05%
Question 19: The decrease in percentage of passed students from 2011 to 2012 approximately is
a) 8.25%
b) 8.27%
c) 8.24%
d) 8.22%
Instructions
In the following questions, the graph shows the demand and production of different companies. Study the graph and answer the questions.

Question 20: The demand of company E is approximately what percentage of the production of company F ?
a) 60%
b) 70%
c) 80%
d) 50%
18000+ Questions – Free SSC Study Material
Answers & Solutions:
1) Answer (A)
Person having maximum no. of distribution will have max. no. of votes
2) Answer (C)
Only in A and C there is a steady increment in production of cotton as in D and E , It is decresed and in B production is equal for two years. Hence answer will be C).
3) Answer (A)
Production of C in year 2003-2004 = 6 per 100 kg in lakh
in year 2004-05 = 11 per 100 kg in lakh
in year 2005-06 = 15 per 100 kg in lakh
Total will be 32 per 100 kg in lakh or 320000000 kg
4) Answer (B)
In B, production is same as its previous year whether in C , it is decreased.
5) Answer (C)
6) Answer (A)
7) Answer (A)
Total no. of students involved in the data is 4 +6 +10+ 8+ 5 = 33.
8) Answer (B)
Clearly, the maximum no. of 10 students got in the interval of 20-30 marks
9) Answer (A)
Total outlay = 40,000 cr
Proposed outlay for irrigation = $\frac{54}{360}$ * 40,000 = 6,000 cr
Proposed outlay for agriculture = $\frac{108}{360}$ * 40,000 = 12,000 cr
Now, outlay for irrigation is x% of that of agriculture.
=> $\frac{6000}{12000}$ * 100 = 50%
=> x = 50
(SHORTCUT)
Degree outlay for irrigation = 54 and for agriculture = 108
Required % = $\frac{54}{108}$ * 100 = 50%
=> x = 50
10) Answer (D)
Degree of proposed outlay for irrigation = 54
Degree of proposed outlay for communication = 45
Required ratio = 54/45 = 6 : 5
11) Answer (C)
Total no. of electronic items in :
2009 = 6000 + 7000 = 13000
2010 = 9000 + 9400 = 18400
2011 = 13000 + 9000 = 22000 [MAX]
2012 = 11000 + 10000 = 21000
2013 = 8000 + 12000 = 20000
=> Total production is maximum in 2011
12) Answer (A)
Total production of LCD’s in 2011 = 9000
Total production of LCD’s in 2013 = 12000
Require ratio = 9000/12000 = 3 : 4
13) Answer (D)
Total no. of TV’s produced from 2009 to 2012 = 6000 + 9000 + 13000 + 11000
=> 39,000
Average production of TV’s over these four years = 39000/4 = 9750
Total no. of LCD’s produced from 2009 to 2012 = 7000 + 9400 + 9000 + 10000 = 35,400
Average production of LCD’s over these four years = 35400/4 = 8850
=> Required Difference = 9750 – 8850 = 900
14) Answer (C)
No. of TV’s produced in 2009 = 6000
No. of TV’s produced in 2010 = 9000
=> Required ratio = 6000/9000 = 2 : 3
15) Answer (C)
Amount required to support the project = 4910 crore
Maximum compensation = 10%
=> 10% of 4910 cr = $\frac{10}{100} * 4910 cr = 491 cr
Amount permitted = 4910 cr + 491 cr = 5401 cr
Get 25 SSC CHSL Mocks – Just Rs. 149
16) Answer (C)
Shortage of funds arranged through External Assistance = 11486 – 9695 = 1791 crores
=> Increase required in market borrowing = Rs. 1791 crore
% increase required = $\frac{1791}{29952}$ * 100 = 5.98%
= ~6%
17) Answer (D)
No. of passed students in 2008 = 110
No. of passed students in 2009 = 138
No. of passed students in 2012 = 156
=> Total no. of students passed in 2008, 2009 & 2012 = 110+138+156 = 404
=> Average students passed over the three years = 404/3 = 134.67
18) Answer (C)
No. of students passed in 2008 = 110
No. of passed students in 2011 = 170
=> % increase = $\frac{170-110}{110}$ * 100 = 54.54%
= ~54.5%
19) Answer (C)
No. of students passed in 2011 = 170
No. of passed students in 2012 = 156
=> % decrease = $\frac{170-156}{170} * 100 = 8.235 \%$
= ~8.24%
20) Answer (A)
Demand of company E = 2800
Production of company F = 4500
Demand of company E as a percentage of production of company F = (2800/4500)*100 = 62.22% = 60% approx.
Option A is the right answer.
Join Exam Preparation Telegram Group


