
SSC CGL Data Interpretation Questions
Download Top-20 Data Interpretation Questions for SSC CGL exam 2020. Most important Data Interpretation Questions questions based on asked questions in previous exam papers for SSC CGL.
Download Top-20 SSC CGL Data Interpretation Questions
Get 125 SSC CGL Mocks – Just Rs. 199
Take a free SSC CGL Tier-1 mock test
Download SSC CGL Tier-1 Previous Papers PDF
Instructions
The pie-chart given below shows expenditure incurred by a family on various items and their savings. Study the chart and answer the questions based on the pie-chart
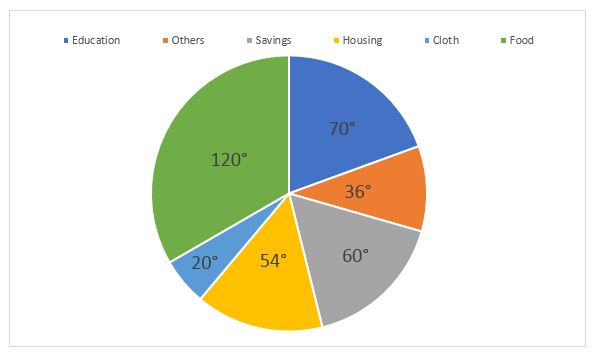
Question 1: If the expenditure on education is 1600 more than that on housing, then the expenditure on food is :
a) 12000
b) 6000
c) 3333
d) 7000
Question 2: If the monthly income is 36000, then the yearly savings is :
a) 70000
b) 72000
c) 60000
d) 74000
Question 3: Among the equations x + 2y + 9 =0 ; 5x-4=0 ; 2y – 13 = 0; 2x- 3y = 0, the equation of the straight line passing through origin is
a) 2x – 3y= 0
b) x + 2y+9=0
c) 5x – 4 = 0
d) 2y – 13=0
Instructions
Given here is a multiple bar diagram of the scores of four players in two innings. Study the diagram and answer the questions:
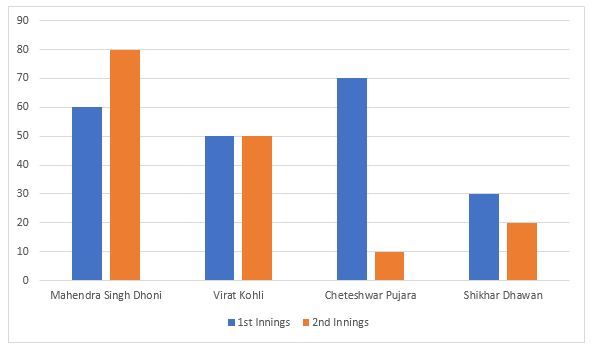
Question 4: The average runs of two innings of the player who scored highest in average are :
a) 70
b) 80
c) 85
d) 75
Question 5: 60 students were asked to choose their favourite sport.
Their distribution is as follows :
Football – 15
Cricket – 12
Swimming – 12
Basketball – 11
Athletics – 10
The data is illustrated in a Pie Chart. What angle should be used for football ?
a) 15°
b) 60°
c) 90°
d) 180°
Instructions
Study the graph and answer the questions.
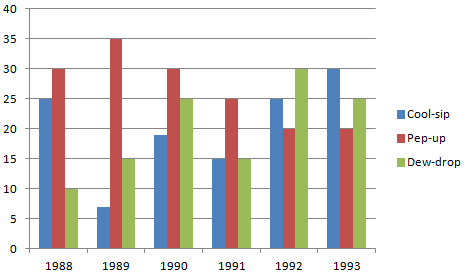
Question 6: In which year the sale of cool-sip is minimum ?
a) 1990
b) 1992
c) 1993
d) None of the above
Question 7: In case of which soft drink was the average annual sale maximum during the
peri0d 1988-1993 ?
a) Pep-up only
b) Pep-up and Dew-drop
c) Cool-sip only
d) Cool-sip and Pep-up
Question 8: What was the approximate percent drop in the sale of Pep-up in 1990 over its sale in 1989 ?
a) 5
b) 14
c) 12
d) 20
Question 9: What was the approximate percent increase in sales of Cool-sip in 1990 over its sales in 1989 ?
a) 100
b) 217
c) 171
d) 150
Question 10: In which year sale of Dew-drop is maximum ?
a) 1988
b) 1992
c) 1989
d) 1993
Join Exam Preparation Telegram Group
Question 11: In case of which soft drink was the average annual sale minimum during the period 1988-1993 ?
a) Pep-up only
b) Cool-sip only
c) Dew-drop only
d) Dew-drop and Cool-sip
Instructions
The following table gives zonewise survey report of the people of a country who take coffee. Study the table and answer the questions.
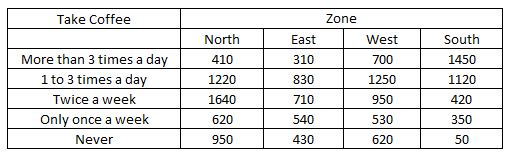
Question 12: The percentage of people of south zone who take coffee at least once a day is close to
a) 33.51
b) 42.72
c) 75.81
d) 80.82
Question 13: The percentage of people from non-west zone who take coffee ‘only once a week’ is approximately
a) 11
b) 12
c) 13
d) 14
Question 14: The ratio of the total number of people surveyed who take coffee more than 3 times a day to the total number of people who do not take coffee at all is
a) 1 : 1.4
b) 1.4 : 1
c) 1.5 : 1
d) 1 : 1.1
Instructions
Study the following graph which shows income and expenditure of a company over the years and answer the questions.
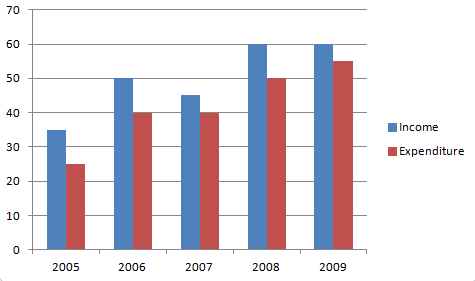
Question 15: The difference in profit (in Rs. crores) of the company during 2007 and 2008 is
a) 5
b) 10
c) 15
d) 20
Get 125 SSC CGL Mocks – Just Rs. 199
Question 16: In how many years was the expenditure of the company more than the average expenditure of the given years ?
a) 4
b) 3
c) 2
d) 1
Question 17: The percentage increase in income of the company from 2007 to 2008 is
a) $30$
b) $25$
c) $33 \frac{1}{3}$
d) $42 \frac{6}{7}$
Question 18: Ratio of total income to total expenditure of the company over the years is
a) 21:25
b) 25:21
c) 26:21
d) 25:22
Question 19: The categories of qualitative variables are represented by bars where the height of each bar is
a) Class frequency
b) Class percentage
c) Class relative frequency
d) All of the above
Instructions
The distribution of fruit consumption in a sample of 72 seventeen – year – old girls is given in the graph below. Study the graph and answer the questions.
Distribution of fruit consumption
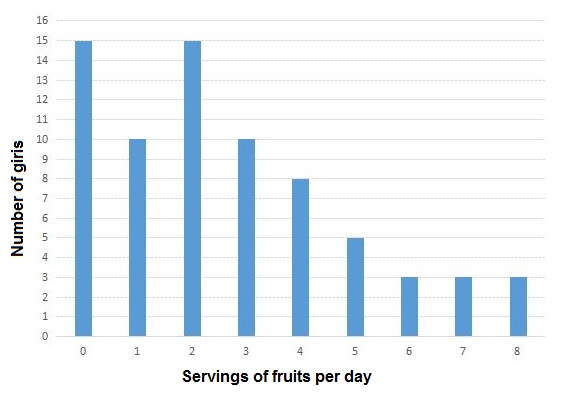
Question 20: How many of these girls ate fewer than two servings per day ?
a) 15
b) 40
c) 25
d) None of these
More SSC CGL Important Questions and Answers PDF
Answers & Solutions:
1) Answer (A)
Let total income = 360$x$
Expenditure on education = $\frac{70}{360} * 360x = 70x$
Expenditure on housing = $\frac{54}{360} * 360x = 54x$
=> Required difference = $70x – 54x$ = 1600
=> $x$ = 100
Expenditure on food = $\frac{120}{360} * 360x = 120x$
=> 120*100 = 12000
2) Answer (B)
Monthly income = 36,000
Monthly savings = $\frac{60}{360}$ * 36000 = 6,000
=> Yearly savings = 12*6000 = 72,000
3) Answer (A)
For a straight line to pass through origin, both of its x & y coordinates should be ‘0’.
(A) : 2x – 3y = 0
=> If x = y = 0, then L.H.S. = 0 = R.H.S
=> It passes through origin
(B) : x + 2y + 9 = 0
=> If x = y = 0, then L.H.S. = 9 $\neq$ R.H.S. = 0
=> It does not pass through origin
(C) : 5x – 4 = 0
=> If x = 0, then L.H.S. = -4 $\neq$ R.H.S. = 0
=> It does not pass through origin
(D) : 2y – 13 = 0
=> If y = 0, then L.H.S. = -13 $\neq$ R.H.S. = 0
=> It does not pass through origin
Ans – (A)
4) Answer (A)
Runs scored in 1st and 2nd innings respectively :
Dhoni = 60+80 = 140 [MAX]
Virat = 50+50 = 100
Pujara = 70+10 = 80
Dhawan = 30+20 = 50
Since, Dhoni scored the maximum in both innings
=> Average = 140/2 = 70
5) Answer (C)
No. of students who like football = 15
Total students = 60
Angle used for football = $\frac{15}{60}$ * 360 = 90°
6) Answer (D)
Sales of cool sip in :
1988 – 25
1989 – 6 [MIN]
1990 – 19
1991 – 15
1992 – 25
1993 – 30
=> Sales of cool sip is minimum in 1989
Ans – (D)
7) Answer (A)
Sales of cool sip from 1988 to 1993 = 25+6+19+15+25+30 = 120
=> Average sales = 120/6 = 20
Sales of pep up = 30+35+30+25+20+20 = 160
=> Average sales = 160/6 = 26.67 [MAX]
Sales of dew drop = 10+15+25+15+30+25 = 120
=> Average sales = 120/6 = 20
Average sales of pep up is maximum
8) Answer (B)
Sales of pep up in 1989 = 35
Sales of pep up in 1990 = 30
=> % decrease = $\frac{35-30}{35}$ * 100 = 14.28%
= ~14%
9) Answer (B)
Sales of cool sip in 1989 = 6
Sales of cool sip in 1990 = 19
=> % increase = $\frac{19-6}{6} * 100 = 216.67\%$
= ~217%
10) Answer (B)
Sales of dew drop in :
1988 – 10
1989 – 15
1990 – 25
1991 – 15
1992 – 30 [MAX]
1993 – 25
=> Sales of dew drop is maximum is 1992
11) Answer (D)
Sales of cool sip from 1988 to 1993 = 25+6+19+15+25+30 = 120
=> Average sales = 120/6 = 20
Sales of pep up = 30+35+30+25+20+20 = 160
=> Average sales = 160/6 = 26.67
Sales of dew drop = 10+15+25+15+30+25 = 120
=> Average sales = 120/6 = 20
Average sales of both cool sip and dew drop is minimum.
12) Answer (C)
Total no. of people in South zone = 1450+1120+420+350+50 = 3390
People who take coffee at least once a day = (1 to 3 times a day) + (more than 3 times a day)
= 1450+1120 = 2570
=> Required % = $\frac{2570}{3390}$ * 100
= 75.81%
13) Answer (D)
Total no. of people in :
North zone = 410+1220+1640+620+950 = 4840
East zone = 310+830+710+540+430 = 2820
South zone = 1450+1120+420+350+50 = 2570
=> Total no. of people in non-west zone = 4840+2820+2570 = 11050
No. of people who take coffee only once a week in non-west zone = 620+540+350 = 1510
=> Required % = $\frac{1540}{11050}$ * 100 = 13.67%
= ~14%
14) Answer (B)
No. of people who take coffee more than 3 times a day = 410+310+700+1450 = 2870
No. of people who never take coffee = 950+430+620+50 = 2050
=> Required ratio = $\frac{2870}{2050}$ = 1.4
=> 1.4 : 1
15) Answer (A)
Profit = Income – Expenditure
Income in 2007 = 45
Expenditure in 2007 = 40
=> Profit in 2007 = 45-40 = 5
Income in 2008 = 60
Expenditure in 2008 = 50
=> Profit in 2008 = 60-50 = 10
Required difference = 10-5 = 5
Get 125 SSC CGL Mocks – Just Rs. 199
18000+ Questions – Free SSC Study Material
16) Answer (C)
Expenditure of the company in :
2005 = 25
2006 = 40
2007 = 40
2008 = 50
2009 = 55
=> Average expenditure = $\frac{25+40+40+50+55}{5}$ = 42
So, only in years ‘2008’ & ‘2009’, the expenditure of the company is greater than the average expenditure.
Ans – (C)
17) Answer (C)
Income of company in 2007 = 45
Income of company in 2008 = 60
=> % increase = $\frac{60-45}{45}$ * 100 = $\frac{100}{3}$
= 33$\frac{1}{3}$%
18) Answer (B)
Total income of the company over the years = 35+50+45+60+60 = 250
Total expenditure = 25+40+40+50+55 = 210
=> Required ratio = $\frac{250}{210}$ = 25 : 21
19) Answer (D)
The categories of qualitative variables are represented by bars where the height of each bar may be class frequency, class percentage and class relative frequency.
20) Answer (C)
No. of girls who ate fewer than 2 servings a day = (No. of girls who ate 0) + (No. of girls who ate 1)
= 15 + 10 = 25
Join Exam Preparation Telegram Group


