
Questions On Data Interpretation for RRB NTPC
Download the most important questions with solutions on Data Interpretation for RRB NTPC exam. Most important RRB NTPC data interpretation questions based on asked questions in previous exam papers for RRB NTPC. These questions are really helpful to crack the RRB NTPC exam.
Download Important Questions On Data Interpretation for RRB NTPC
Get 20 RRB NTPC Mocks – Just Rs. 149
Take a free RRB NTPC mock test
Download RRB NTPC Previous Papers PDF
Instructions
The following table shows the sectoral distribution of production of Fabrics in India
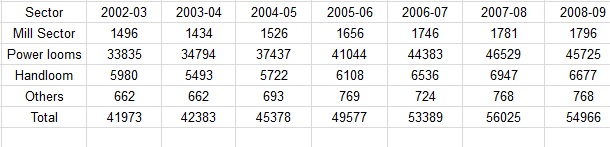
Question 1: If the same % decrease in the production of fabrics in 2008-09 continues the next year also what is the production in 2009-10 ?
a) 53972
b) 53927
c) 53792
d) 53279
Instructions
Study the following table and answer the questions based on it.
Below is the Household Expenditure (in Thousand rupees) per annum.
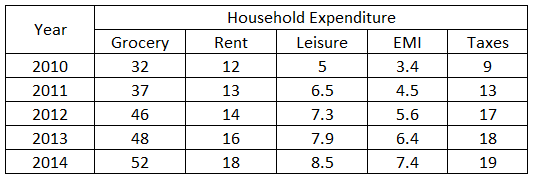
Question 2: What is the total Household Expenditure for the year 2012?
a) Rs. 89,900
b) Rs. 87,120
c) Rs. 89,100
d) Rs. 88,200
Question 3: Expenditure on EMI forms *hat percentage of expenditure on Grocery for the year 2014?
a) 11.34 %
b) 14.23 %
c) 13.22 %
d) 15.55 %
Question 4: What is the average spending on Leisure per annum?
a) Rs. 7,040
b) Rs. 6,500
c) Rs. 7,100
d) Rs. 7,400
Instructions
Study the following table and answer the questions below
Given below is the list of Expenditures (in lakh Rupees) per annum of company Z Over the Years.
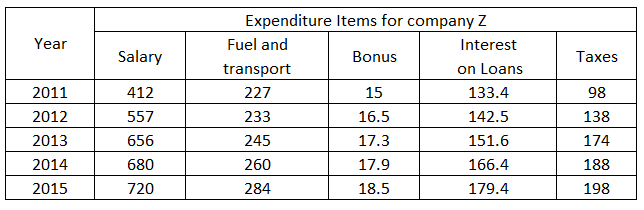
Question 5: What is the average amount of Bonus per year?
a) Rs. 17.04 Lakhs
b) Rs. 17 Lakhs
c) Rs. 17.4 Lakhs
d) Rs. 16.8 Lakhs
Question 6: What is the total expenditure of Company Z in the year 2011?
a) Rs. 897.2 Lakhs
b) Rs. 827.5 Lakhs
c) Rs. 885.4 Lakhs
d) Rs. 727.1 Lakhs
Question 7: What is the expenditure on Fuel and Transport as a percentage of expenditure on Salary for the year 2012?
a) 41.8%
b) 40.1%
c) 43.1%
d) 44.2%
Instructions
The following table represents the marks of four students in five subjects.
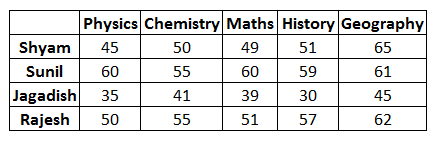
Consider the information and answer questions based on it.
Question 8: The difference between the total marks scored by Sunil and Jagdish is
a) 190
b) 125
c) 105
d) 115
Question 9: Who has the highest average marks?
a) Shyam
b) Sunil
c) Jagdish
d) Rajesh
Instructions
Consider the table and answer questions based on it
The following table represents the category wise count of books in four local libraries.
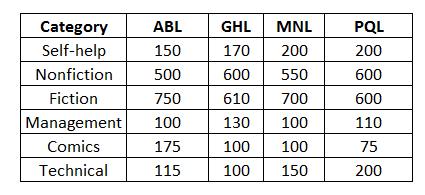
Question 10: Which library has the highest total count of books?
a) ABL
b) GHL
c) MNL
d) PQL
Join Exam Preparation Telegram Group
Question 11: The difference between the total number of nonfiction and management books of all four libraries is
a) 1850
b) 1810
c) 2250
d) 1800
Instructions
Study the following table and answer the questions:
The table below depicts the Number of Books Sold by 5 cities during 5 months.
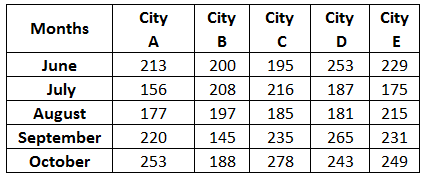
Question 12: if 30% of the total number of books sold by City B, D and E together in July were academic books, how many non — academic books were sold by the same Cities together in the same month?
a) 379
b) 389
c) 399
d) 309
Question 13: What is the respective ratio between the total number of books sold by City A in July and September together and total number of books sold by City E in August and October together?
a) 57 : 49
b) 49 : 57
c) 58 : 47
d) 47 : 58
Question 14: What is the average number of books sold by City C in July, September and October together?
a) 243
b) 242
c) 234
d) 224
Instructions
Read the table and answer the questions based on it.
The table below represents the distance (in km) travelled by six trucks on six different days of the week.
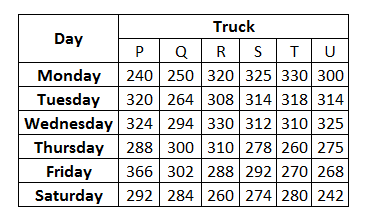
Question 15: If to travel the given distance, the time taken by Truck Q on Friday was 8 hours, then what was its average speed on that day?
a) 37.75km/hr
b) 42.50 km/hr
c) 28.25 km/hr
d) 32.25 kn/hr
Get 20 RRB NTPC Mocks – Just Rs. 149
Question 16: What is the total distance travelled by all the trucks together on Saturday’?
a) 1623 km
b) 1263 km
c) 1362 km
d) 1632 km
Instructions
Answer the questions based on the following bar chart:
The following bar chart shows the trends of mutual funds investments into India from all over the world.
India’s Mutual Funds Investment
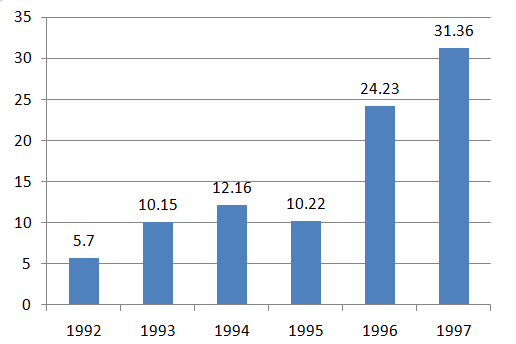
Question 17: If India mutual fuds investiments from countries was proportionately the same in 1992 and 1997 as the total mutual funds investments from all over the world and lithe mutual funds investments in 1992 from the countries was Euro 2 million. What was the amount of mutual funds investments from the countries in 1997?
a) 11
b) 0.72
c) 11.28
d) 11.5
Instructions
Study the following diagram and answer questions based on it.
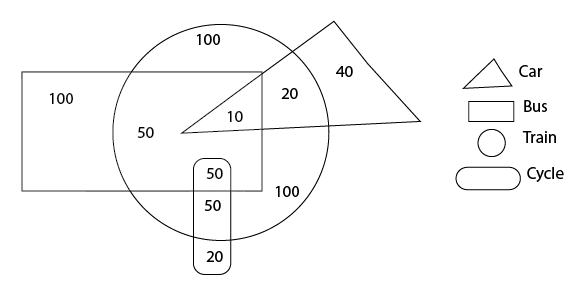
Question 18: The ratio of total number of train travelers to the people who do not travel by train is
a) 27/16
b) 28/16
c) 37/16
d) 38/16
Instructions
Consider the bar chart and answer questions based on it.
The bar chart represents number of fiction and non-fiction books in four libraries L1, L2, L3 and L4.
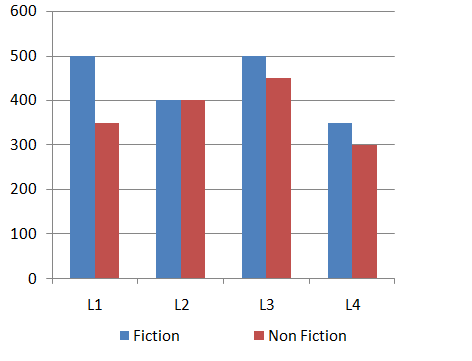
Question 19: The ratio of total books of libraries Ll and L3 to L2 and L4 is
a) 29/36
b) 33/32
c) 36/29
d) 32/33
Question 20: The ratio of total number of Non Fiction to Fiction books in all libraries is
a) 7/6
b) 6/7
c) 15/17
d) 17/15
Download RRB NTPC Previous Papers
Answers & Solutions:
1) Answer (B)
percentage loss in 2008-09=(56025-54966)/56025 ×100=1.89%
the percentage loss in 2009-10 is 1.89%
=> the fabric production in 2009-10=98.11% of 54966=53927.68≅= 53927
2) Answer (A)
Total household expenditure for year 2012
=(46 + 14 + 7.3 + 5.6 + 17) $\times 1000$
=89,900
So, the answer would be option a)Rs. 89,900
3) Answer (B)
Expenditure on EMI = 7.4
Expenditure on Grocery = 52
Required percentage = $\frac{7.4}{52} \times 100$ = 14.23 %
So, the answer would be option b)14.23 %
4) Answer (A)
Average spending on Leisure per annum = $ \frac{(5 + 6.5 + 7.3 + 7.9 + 8.5) \times 1000}{5} = 7040$
So, the answer would be option a)Rs. 7,040
5) Answer (A)
Expenditures on Bonus by years :
in 2011 : 15 lakhs
in 2012 : 16.5 lakhs
in 2013 : 17.3 lakhs
in 2014 : 17.9 lakhs
in 2015 : 18.5 lakhs
so,total expenditure made on Bonus over these five years
$=15+16.5+17.3+17.9+18.5$
$=85.2$.
So, average amount of bonus per year
$=85.2/5=17.04$ lakhs.
A is correct choice.
6) Answer (C)
In 2011 expenditure made by company Z in different sectors are :
Salary=412 lakhs.
Fuel and Transport=227 lakhs.
Bonus=15 lakhs.
Interest on loans=133.4 lakhs.
Tsxes=98 lakhs.
So, in 2011,total expenditure made by company Z was$=412+227+15+133.4+98$lakhs
$=885.4$lskhs.
C is correct choice.
7) Answer (A)
In 2012 , expenditure on Fuel and Transport was =233 lakhs and expenditure on salary was =557 lakhs.
So,the required percentage would be
$=(233/557)×100.$
$=41.83$.
A is correct choice.
8) Answer (C)
Sunil = 60+55+60+59+61= 295
Jagdish= 35+41+39 +30+45 =190
Difference =105
9) Answer (B)
Shyam = $\frac{45+50+49+51+65}{5}$ = 51
Sunil = $\frac{60+55+60+59+61}{5}$= 59
Jagdish= $\frac{35+41+39 +30+45}{5}$= 38
Rajesh = $\frac{50+55+51+57+62}{5}$ = 55
Sunil has the highest average marks
10) Answer (C)
ABL = 1790
GHL= 1710
MNL= 1800
PQL= 1785
the highest total count of books = MNL
11) Answer (B)
Nonfiction = (500+600+550+600)= 2250
Management = (100+130+100+ 110) = 440
difference = 1810
12) Answer (C)
total number of books sold by City Bin July=208
total number of books sold by City D in July=187
total number of books sold by City E in July=175
total number of books sold by City B, D and E together in July=208+187+175=570
30% of 570=$\frac{30}{100}\times570=171$
non — academic books=570-171=399
13) Answer (D)
total number of books sold by City A in July and September=156+220=376
total number of books sold by City E in August and October=215+249=464
Ratio=376:464=47:58
14) Answer (A)
Total book sold by City C in July ,September and October=216+235+278=729
Average=729/3=243
15) Answer (A)
$Avg Speed=\frac{Total distance}{Time}$
$Avg Speed=\frac{302}{8}$
37.75km/hr
Get 20 RRB NTPC Mocks – Just Rs. 149
16) Answer (D)
total distance travelled on sunday=292+284+260+274+280+242=1632km
17) Answer (A)
18) Answer (D)
Total number of train travelers = 100 + 10 + 20 + 50 + 50 + 50 + 100 = 380
Number of people who do not travel with train = 100 + 40 + 20 = 160
Required ratio = 380 : 160 = 38 : 16.
19) Answer (C)
Total number of books from L1 and L3 = (500 + 350) + (500 + 450) = 1800
Total numbers of books from L2 and L4 = (400 + 400) + (350 + 300) = 1450
Required ratio = 1800 : 1450 = 36 : 29.
20) Answer (B)
Total number of non fiction books = 350 + 400 + 450 + 300 = 1500
Total number of fiction books = 500 + 400 + 500 + 350 = 1750
Required ratio = 1500 : 1750 = 6 : 7.


