
IIFT Bar Graph Questions PDF
Download important IIFT Bar Graph Questions PDF based on previously asked questions in IIFT and other MBA exams. Practice Bar Graph Questions and answers for IIFT and other exams.
Download IIFT Bar Graph Questions PDF
Get Complete MBA Test Series for Rs. 799
Download IIFT Previous Papers PDF
Instructions
Answer the questions based on the following graph.

Question 1: In which year the annual growth rate of total production (of all products) is highest?
a) 1991
b) 1992
c) 1993
d) 1995
Question 2: If the stability of the production during 1990 to 1995 is defined as,
a) Product P
b) Product Q
c) Product R
d) Product S
Question 3: If four products P, Q, R and S shown in the graph are sold at price of Rs. 9, Rs. 4, Rs.13 and Rs.3 respectively during 1990-1995, then the total revenue of all the products is lowest in which year?
a) 1991
b) 1992
c) 1993
d) None of the above
Question 4: Individual revenue of P, Q, R and S for the entire period (1990-1995) is calculated based on the price of Rs.9, Rs.4, Rs.13 and Rs.3 respectively. Which product fetches the lowest revenue?
a) Product P
b) Product Q
c) Product R
d) Product S
Question 5: Four products P, Q, R and S shown in the graph are sold at price of Rs.9, Rs.4, Rs.13 and Rs.3 respectively during 1990-1995. Which of the following statements is TRUE?
a) Product R fetches second highest revenue across products in 1991.
b) Sum of revenue of P, Q and S is more than the revenue of R in 1994.
c) Cumulative revenue of P and Q is more than the revenue of S in 1993.
d) None of the above
Instructions
Read the following information and graph and answer the questions that follow.
An international Organisation produces a Competitive Index of countries every two years based on eight factors (Institutions, Infrastructure, Macroeconomic Environment, Higher Education, Market Efficiency, Technological Readiness, Business Sophistication and Innovation). The last three indices were developed in 2010, 2012 and 2014. The scores for all eight factors of XYZ country are shown in the graph below:

Question 6: If Factor performance is measured as 0.30 × Factor Score in 2014 + 0.35 × Factor Score in 2012 + 0.35 × Factor Score in 2010, then which of the following has best Factor Performance?
a) Innovation
b) Business Sophistication
c) Infrastructure
d) Macroeconomic Environment
Question 7: If Factor Performance is measured as
$\frac{ \text {Factor Score 2014 – Factor Score 2012 }}{ \text{Factor Score 2010}}$
then which of the following has best Factor Performance?
a) Innovation
b) Business Sophistication
c) Infrastructure
d) Macroeconomic Environment
Question 8: Which of the following factors has the highest average score across indices of 2010, 2012 and 2014?
a) Infrastructure
b) Institutions
c) Technological Readiness
d) Market Efficiency
Question 9: Which among the following factors had the least growth rate in 2014 versus scores of 2010?
a) Business Sophistication
b) Institutions
c) Technological Readiness
d) Infrastructure
Instructions
Answer the questions based on the following graphs
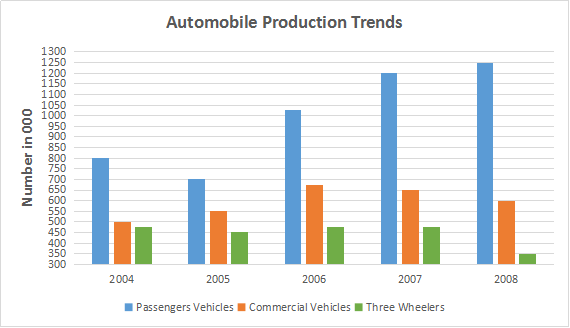
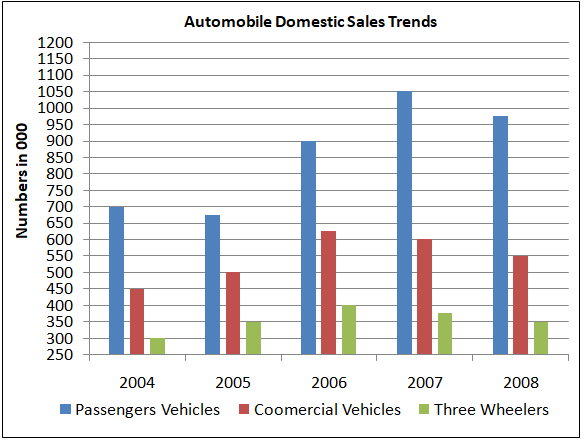
Question 10: The ratio between absolute increase in domestic sales over preceding year and absolute increase in production over the preceding year is highest during which year?
a) 2005
b) 2006
c) 2007
d) 2008
Answers & Solutions:
1) Answer (B)
2) Answer (D)
3) Answer (C)
4) Answer (B)
5) Answer (C)
Let’s look at the options one by one ,
Option A: Revenue by products P = 25*9 = 225 , Q = 40*4 = 160 , R = 91*13 = 1183, S = 159*3 = 477
Revenue of R is the highest. Hence A is not the correct answer.
Option B: Revenue by products P = 75*9 = 675, Q = 40*4 = 160 , R = 131*13 = 1703, S = 88*3 = 264
Sum of revenues of P, Q, S =1094
The combined revenue of P, Q, S is less than the revenue from R in 1994.
Hence B is not the correct answer.
Option C: Revenue by products P = 35*9 = 315, Q = 60*4 = 240, R = 62*13 = 806, S = 140*3 = 420
The cumulative revenue of P and Q = 555
The cumulative revenue of P and Q is more than the revenue of S in 1993.
Hence C is the correct answer.
Download IIFT Previous Papers PDF
6) Answer (D)
Factor performance is measured as 0.30 × Factor Score in 2014 + 0.35 × Factor Score in 2012 + 0.35 × Factor Score in 2010
Let’s calculate Factor performance for each of the given options.
Factor performance For Innovation = 0.3*4.5+0.35*4+0.35*4.75 = 4.4125
Factor performance for Business Sophistication =0.3*5.25+0.35*4.75+0.35*4.5=4.8125
Factor performance for Infrastructure = 0.3*5.25+0.35*4+0.35*4 = 4.375
Factor performance for Macroeconomic Environment =0.3*5.5+0.35*4.5+0.35*4.75 = 4.8875
Factor performance for Macroeconomic Environment is the highest.
Hence option D is the correct answer.
7) Answer (C)
Factor performance in Innovation = $\dfrac{4.5 – 4}{4.75}\times 100$ = 10.53
Factor performance in Business Sophistication = $\dfrac{5.25 – 4.75}{4.5}\times 100$ = 11.11
Factor performance in Infrastructure = $\dfrac{5.25 – 4}{4}\times 100$ = 31.25
Factor performance in Macroeconomic Environment = $\dfrac{5.5 – 4.5}{4.75}\times 100$ = 21.05
We can see that option C is the correct answer.
8) Answer (B)
For Infrastructure
Average of the indices = 4+4+5.25/3=13.25/3
=4.4167
For Institutions
Average of the indices =4.25+4.75+4.5/3=13.5/3
=4.5
For Technological readiness
Average of the indices =3.5+3.75+5.5/3=12.75/3
=4.25
For Market Efficiency
Average of the indices =4.25+4.5+4.25/3=13/3
=4.33
The average of the index is highest for Institutions.
Hence B is the correct answer.
9) Answer (B)
The growth rate in 2014 versus scores of 2010 for Business Sophistication =5.25/4.5 = 1.167
Growth rate in 2014 versus scores of 2010 for Institutions = 4.5/4.25 = 1.058
Growth rate in 2014 versus scores of 2010 for Technological Readiness = 5.5/3.5 = 1.571
Growth rate in 2014 versus scores of 2010 for Infrastructure = 5.25/4 = 1.3125
Among the above values, growth rate for institutions was least.
Hence B is the correct answer.
10) Answer (B)
Total automobile production in the year 2004 = 800+500+475 = 1775
Total automobile production in the year 2005 = 700+550+450 = 1700
Total automobile production in the year 2006 = 1025+675+475 = 2175
Total automobile production in the year 2007 = 1200+650+475 = 2325
Total automobile production in the year 2008 = 1250+600+350 = 2200
Total domestic sales of automobiles in the year 2004 = (700+450+300) = 1450
Total domestic sales of automobiles in the year 2005 = (675+500+350) = 1525
Total domestic sales of automobiles in the year 2006 = (900+625+400) = 1925
Total domestic sales of automobiles in the year 2007 = (1050+600+375) = 2025
Total domestic sales of automobiles in the year 2008 = (975+550+350) = 1875
In the year 2005 and 2008 the production and sales respectively are not increasing absolutely. Hence, we will check only for the year 2006 and 2007.
The ratio between absolute increase in domestic sales in the year 2006 over the year 2005 and absolute increase in production in the year 2006 over the year 2005 = $\dfrac{1925-1525}{2175-1700}$ = 0.84
Similarly, the required ratio for year 2007 = $\dfrac{2025-1925}{2325-2175}$ = 0.66
Hence, we can say that the ratio is the highest for the year 2006. Therefore, option B is the correct answer.
IIFT Previous year question answer PDF
We hope this Bar Graph questions and answers for IIFT PDF will be helpful to you.


