
CAT Special Charts Questions [Download PDF]
Special Charts is one of the important types of charts in the CAT LRDI section. These sets are usually not very tough, and hence you should not miss out on the questions from Special charts (spider charts, bubble charts, etc). Firstly, understand the data given in the Special Charts. Also, learn the ways to Represent the data in Special Charts. You can check out these CAT Special Charts-based questions from the CAT Previous year’s papers. In this post, we will look at some important Special Charts Sets in the CAT LRDI section. These are a good source of practice for CAT preparation; If you want to practice these questions, you can download this Special Charts Questions for CAT LRDI PDF along with the detailed solutions (and video solutions) below, which is completely Free.
Download Special Charts Questions for CAT
Instructions
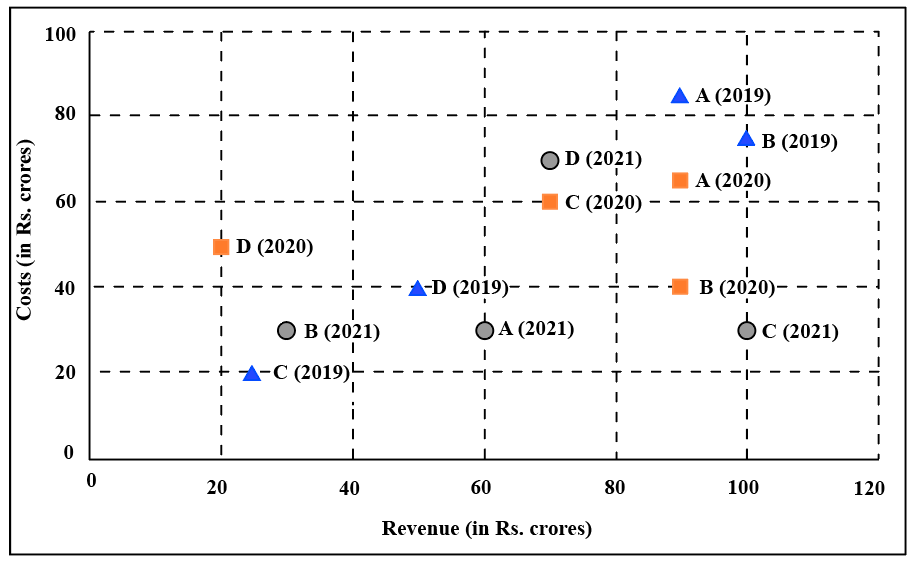
The two plots below show data for four companies code-named A, B, C, and D over three years – 2019, 2020, and 2021.
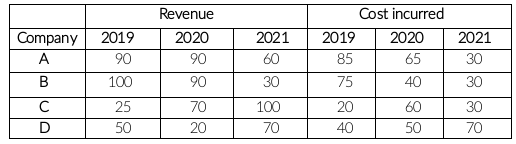
The first plot shows the revenues and costs incurred by the companies during these years. For example, in 2021, company C earned Rs.100 crores in revenue and spent Rs.30 crores. The profit of a company is defined as its revenue minus its costs
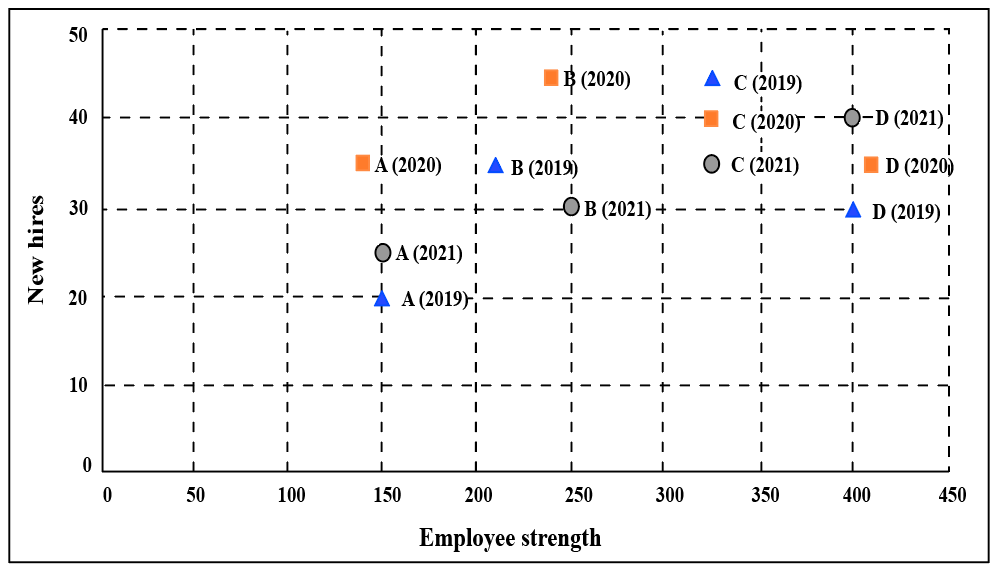
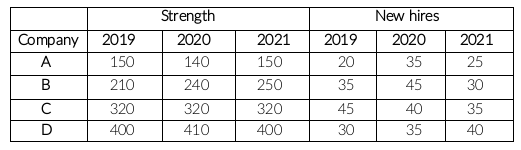
The second plot shows the number of employees employed by the company (employee strength) at the start of each of these three years, as well as the number of new employees hired each year (new hires). For example, Company B had 250 employees at the start of 2021, and 30 new employees joined the company during the year.
Question 1: Profit per employee is the ratio of a company’s profit to its employee strength. For this purpose, the employee strength in a year is the average of the employee strength at the beginning of that year and the beginning of the next year. In 2020, which of the four companies had the highest profit per employee?
a) Company D
b) Company C
c) Company B
d) Company A
1) Answer (C)
Solution:
It is given,


Company A = $\frac{90-65}{145}=\frac{25}{145}=\frac{50}{290}$
Company B = $\frac{90-40}{245}=\frac{50}{245}$
Company C = $\frac{70-60}{320}=\frac{10}{320}$
Company B had the highest profit per employee.
The answer is option C.
Question 2: The total number of employees lost in 2019 and 2020 was the least for:
a) Company B
b) Company D
c) Company A
d) Company C
2) Answer (A)
Solution:
It is given,
Company A:
The number of employees in the beginning of 2019 = 150
The number of employees hired in 2019 = 20
The number of employees should be at the beginning of 2020 is 150+20, i.e. 170 but there are 140 only. This implies 30 left company A in 2019.
The number of employees in the beginning of 2020 = 140
The number of employees hired in 2020 = 35
The number of employees should be at the beginning of 2021 is 140+35, i.e. 175 but there are 150 only. This implies 25 left company A in 2020.
The number of employees left company A in 2019 and 2020 = 30 + 25 = 55
Company B:
Similarly, the number of employees left company B in 2019 = 210 + 35 – 240 = 5
The number of employees left company B in 2020 = 240 + 45 – 250 = 35
The number of employees left company B in 2019 and 2020 = 5 + 35 = 40
Company C:
Similarly, the number of employees left company C in 2019 = 320 + 45 – 320 = 45
The number of employees left company C in 2020 = 320 + 40 – 320 = 40
The number of employees left company C in 2019 and 2020 = 45 + 40 = 85
Company D:
Similarly, the number of employees left company D in 2019 = 400 + 30 – 410 = 20
The number of employees left company D in 2020 = 410 + 35 – 400 = 45
The number of employees left company D in 2019 and 2020 = 20 + 45 = 65
The total number of employees lost in 2019 and 2020 is least for company B.
The answer is option A.
Question 3: The ratio of a company’s annual profit to its annual costs is a measure of its performance. Which of the four companies had the lowest value of this ratio in 2019?
a) Company A
b) Company D
c) Company B
d) Company C
3) Answer (A)
Solution:
It is given,
Measure of A’s performance in 2019 = $\frac{90-85}{85}=\frac{5}{85}=0.06$
Measure of B’s performance in 2019 = $\frac{100-75}{75}=\frac{25}{75}=0.33$
Measure of C’s performance in 2019 = $\frac{25-20}{25}=\frac{5}{25}=0.2$
Measure of D’s performance in 2019 = $\frac{50-40}{40}=\frac{10}{40}=0.25$
Company A had the lowest value.
The answer is option A.
Question 4: Which of the four companies experienced the highest annual loss in any of the years?
a) Company C
b) Company A
c) Company B
d) Company D
4) Answer (D)
Solution:

For all the companies in all three years, cost incurred is less than Revenue except for D in 2020.
Revenue is 20 and cost incurred is 50
Company D experienced the highest annual loss in 2020.
The answer is option D.
Question 5: Considering all three years, which company had the highest annual profit?
a) Company A
b) Company D
c) Company B
d) Company C
5) Answer (D)
Solution:
It is given,
Company A:
Revenue = 240 and cost incurred = 180
Profit = 240 – 180 = 60
Company B:
Revenue = 220 and cost incurred = 145
Profit = 220 – 145 = 75
Company C:
Revenue = 195 and cost incurred = 110
Profit = 195 – 110 = 85
Company D:
Revenue = 140 and cost incurred = 160
No profit.
Company C had the highest annual profit.
The answer is option D.
Instructions
Five vendors are being considered for a service. The evaluation committee evaluated each vendor on six aspects – Cost, Customer Service,Features, Quality, Reach, and Reliability. Each of these evaluations are on a scale of 0 (worst) to 100 (perfect). The evaluation scores on these aspects are shown in the radar chart. For example, Vendor 1 obtains a score of 52 on Reliability, Vendor 2 obtains a score of 45 on Features and Vendor 3 obtains a score of 90 on Cost.

Question 6: List of all the vendors who are among the top three vendors on all six aspects is:
a) Vendor 1 and Vendor 3
b) None of the Vendors
c) Vendor 3
d) Vendor 1
6) Answer (C)
Solution:
The data can be tabulated as follows(approximately):

Top 3 on Reliability: Vendor 3, Vendor 5, Vendor 1
Top 3 on Reach: Vendor 1, Vendor 5, Vendor 3
Top 3 on Quality: Vendor 1, Vendor 2, Vendor 3
Top 3 on Features: Vendor 4, Vendor 5, Vendor 3
Top 3 on Customer Services: Vendor 4, Vendor 1, Vendor 3
Top 3 on Cost: Vendor 3, Vendor 2, Vendor 1
Only Vendor 3 ranks among top 3 in all the six parameters.
Question 7: List of all the vendors who are among the top two scorers on the maximum number of aspects is:
a) Vendor 2, Vendor 3 and Vendor 4
b) Vendor 1 and Vendor 5
c) Vendor 2 and Vendor 5
d) Vendor 1 and Vendor 2
7) Answer (B)
Solution:
The data can be tabulated as follows(approximately):
Top 3 on Reliability: Vendor 3, Vendor 5
Top 3 on Reach: Vendor 1, Vendor 5
Top 3 on Quality: Vendor 1, Vendor 2
Top 3 on Features: Vendor 4, Vendor 5
Top 3 on Customer Services: Vendor 4, Vendor 1
Top 3 on Cost: Vendor 3, Vendor 2
Vendor 1: 3 times Vendor 2: Only once Vendor 3: 2 times Vendor 4: 2 times Vendor 5: 3 times
Here 1 and 5 comes 3 times. Hence B is the answer.
Question 8: A vendor’s final score is the average of their scores on all six aspects. Which vendor has the highest final score?
a) Vendor 4
b) Vendor 2
c) Vendor 1
d) Vendor 3
8) Answer (D)
Solution:
The data can be tabulated as follows(approximately):

The average of the vendor will be highest which has highest total score. Hence vendor 3 has the highest average.
Question 9: On which aspect is the median score of the five vendors the least?
a) Customer Service
b) Cost
c) Reliability
d) Quality
9) Answer (A)
Solution:
The data can be tabulated as follows(approximately):
Customer Services: 28,41,50,55,70 (The median is 50)
Cost: 50,71,77,81,90 (The median is 77)
Reliability: 26, 40, 52, 60, 75 (The median is 52)
Quality: 40, 48, 62, 69, 72 (The median is 62)
Features: 40, 45, 56, 75, 90 (The median is 56)
Reach: 46, 58, 63, 70, 80 (The median is 63)
Hence the customer services has the lowest median.
Instructions
A large store has only three departments, Clothing, Produce, and Electronics. The following figure shows the percentages of revenue and cost from the three departments for the years 2016, 2017 and 2018. The dotted lines depict percentage levels. So for example, in 2016, 50% of store’s revenue came from its Electronics department while 40% of its costs were incurred in the Produce department.


In this setup, Profit is computed as (Revenue – Cost) and Percentage Profit as Profit/Cost × 100%.
It is known that
1. The percentage profit for the store in 2016 was 100%.
2. The store’s revenue doubled from 2016 to 2017, and its cost doubled from 2016 to 2018.
3. There was no profit from the Electronics department in 2017.
4. In 2018, the revenue from the Clothing department was the same as the cost incurred in the Produce department.
Question 10: What was the approximate difference in profit percentages of the store in 2017 and 2018?
a) 15.5
b) 25.0
c) 8.3
d) 33.3
10) Answer (C)
Solution:
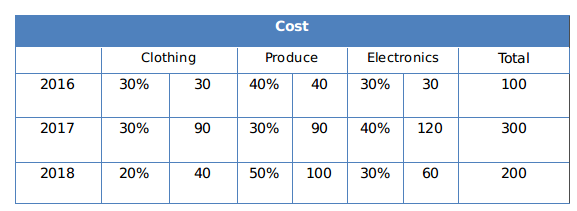
We can make the following table from the web chart given in the question:
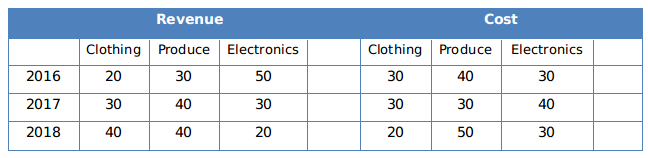
If we consider the total cost in the year
2016 as 100, then according to Statement 1, the total revenue in 2016 must be 200.
The store’s revenue doubled from 2016 to 2017, thus the total revenue in the year 2017 = 400.
We can find the revenue for the individual department in the year 2017, from the table.
There was no profit from the Electronics department in 2017, thus, we can find the total cost in 2017= 300
Considering the statement 4, we can find the total revenue in 2018 and tabulate the following table.
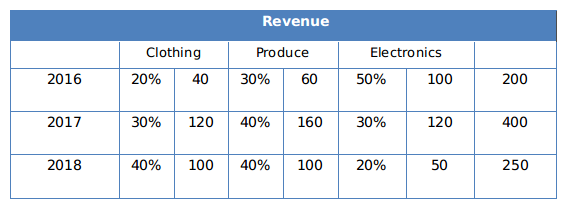
Profit percentage in 2017= (400-300)/300 %= 33.33%
Profit percentage in 2018= (250-200)/200 %= 25%
The approximate difference in profit percentages of the store in 2017 and 2018= (33.33-25)%= 8.33%
Option C.
Question 11: What percentage of the total profits for the store in 2016 was from the Electronics department?
11) Answer: 70
Solution:
We can make the following table from the web chart given in the question:
If we consider the total cost in the year
2016 as 100, then according to Statement 1, the total revenue in 2016 must be 200.
The store’s revenue doubled from 2016 to 2017, thus the total revenue in the year 2017 = 400.
We can find the revenue for the individual department in the year 2017, from the table.
There was no profit from the Electronics department in 2017, thus, we can find the total cost in 2017= 300
Considering the statement 4, we can find the total revenue in 2018 and tabulate the following table.
Profit in 2016 = 200-100= 100
Profit in the electronic department in 2016= 100-30=70
The total profits= for the store in 2016 were from the Electronics department 70%
Question 12: What was the ratio of revenue generated from the Produce department in 2017 to that in 2018?
a) 16 : 9
b) 4 : 3
c) 9 : 16
d) 8 : 5
12) Answer (D)
Solution:
We can make the following table from the web chart given in the question:
If we consider the total cost in the year
2016 as 100, then according to Statement 1, the total revenue in 2016 must be 200.
The store’s revenue doubled from 2016 to 2017, thus the total revenue in the year 2017 = 400.
We can find the revenue for the individual department in the year 2017, from the table.
There was no profit from the Electronics department in 2017, thus, we can find the total cost in 2017= 300
Considering the statement 4, we can find the total revenue in 2018 and tabulate the following table.
The ratio of revenue generated from the Produce department in 2017 to that in 2018 = 160:100= 8:5
Question 13: What was the percentage profit of the store in 2018?
13) Answer: 25
Solution:
We can make the following table from the web chart given in the question:
If we consider the total cost in the year
2016 as 100, then according to Statement 1, the total revenue in 2016 must be 200.
The store’s revenue doubled from 2016 to 2017, thus the total revenue in the year 2017 = 400.
We can find the revenue for the individual department in the year 2017, from the table.
There was no profit from the Electronics department in 2017, thus, we can find the total cost in 2017= 300
Considering the statement 4, we can find the total revenue in 2018 and tabulate the following table.
The percentage profit of the store in 2018= (250-200)/200= 25%


