
DI Charts Questions for CAT [Download PDF]
DI Charts questions are very important in the CAT LRDI section. These questions require more practice but are not very tough; make sure you are aware of all the Important Concepts in CAT DI Charts. You can also check out these CAT DI Charts questions from the CAT Previous year papers. This post will look into some important DI Charts Sets for CAT. These are a good source of practice for CAT 2022 preparation. If you want to practice these DI Sets, you can download these Important DI Charts Questions for CAT (with detailed answers) PDF along with the video solutions below, which is completely Free.
Download DI Charts Questions for CAT
Enroll for CAT 2022 Crash Course
Instructions
Based on the information answer the questions which follow.
The data was collected for an industry in order to analyse the impact and importance of select parameters. The Figure represents performance of the industry on select parameters which arc Fixed Capital. Materials, Value added and Number of Factories from the year 2008-09 to 2015-16. Total inputs – (Output — Value added). Table represents select performance indicators which are Output, Number of Workers and Emoluments from the year 2008-09 to 2015-16.
Figure: Industry Indicators from 2008-09 to 2015-16

Table: Industry Indicators from 2008-09 to to 2015-16

Question 1: In which of the following year annual growth rate in emoluments per worker is highest?
a) 2009 – 10
b) 2011 – 12
c) 2014 – 15
d) 2015 – 16
1) Answer (A)
Solution:

Emoluments per worker is highest in the year 2009-10.
The answer is option A.
Instructions
Read the information given below and answer the 3 associated questions.
The following graph depicts sector-wise percentage contributions to the gross domestic product (GDP) of nine nations, labelled “Nation A”, “Nation B” and so on. It is known that these nations are Brazil, China, France, Germany,India, Japan, Russia, the UK and the USA, but not necessarily in the same order.

The following, however, are known:
i) The GDPs of the nine nations (in US $ trillion) are:

ii) China has the highest agriculture sector GDP, valued at US $1 trillion, followed respectively by the USA and India
iii) In terms of percentage contribution to the respective nations’ GDPs by their service sectors, the UK and France are respectively the first and the second
iv) Nation A, Nation B and Nation G have the same GDP
v) The GDPofIndia’s industry sector is lower than the GDP of Russia’s industry sector. However,it is larger than that of Brazil’s industry sector
Question 2: Based on the given information, which of the following CANNOT be ruled out?
a) US is Nation I
b) Russia is Nation G
c) China is Nation C
d) Japan is Nation E
e) India is Nation B
2) Answer (D)
Solution:
FRom ii, China is F.
FRom iv and v, India must be A, Brazil must be G and Russia must be B.
India’s GDP due to agriculture = 17% of 2 trillion =0.34 trillion.
FRom i, USA GDP due to agriculture> 0.34 trillion and <1 trillion i.e. it’s percentage must be >2% and less than 5.8%
So, USA can be C/E/H.
From point 3, UK must be D and France must be H=> U.S.A must be C/E.
Now, Germany and Japan can be C or I or E.
.’. Everything except option D can be ruled out.
Question 3: Based on the given information, how many nations can be uniquely identified?
a) 6
b) 9
c) 3
d) 2
e) 7
3) Answer (A)
Solution:
FRom ii, China is F.
FRom iv and v, India must be A, Brazil must be G and Russia must be B.
India’s GDP due to agriculture = 17% of 2 trillion =0.34 trillion.
FRom i, USA GDP due to agriculture> 0.34 trillion and <1 trillion i.e. it’s percentage must be >2% and less than 5.8%
So, USA can be C/E/H.
From point 3, UK must be D and France must be H=> U.S.A must be C/E.
Now, Germany and Japan can be C or I.
6 nations can be uniquely identified.
Instructions
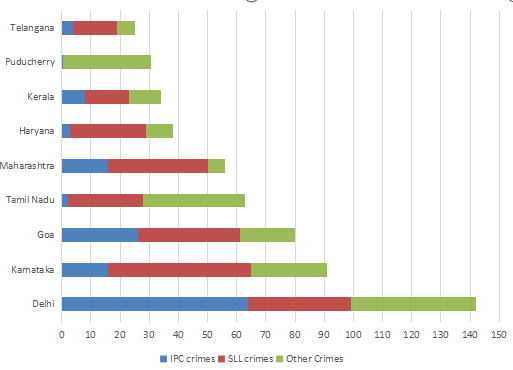
The Ministry of Home Affairs is analysing crimes committed by foreigners in different states and union territories (UT) of India. All cases refer to the ones registered against foreigners in 2016.
The number of cases – classified into three categories: IPC crimes, SLL crimes and other crimes – for nine states/UTs are shown in the figure below. These nine belong to the top ten states/UTs in terms of the total number of cases registered. The remaining state (among top ten) is West Bengal, where all the 520 cases registered were SLL crimes.
The table below shows the ranks of the ten states/UTs mentioned above among ALL states/UTs of India in terms of the number of cases registered in each of the three category of crimes. A state/UT is given rank r for a category of crimes if there are (r‐1) states/UTs having a larger number of cases registered in that category of crimes. For example, if two states have the same number of cases in a category, and exactly three other states/UTs have larger numbers of cases registered in the same category, then both the states are given rank 4 in that category. Missing ranks in the table are denoted by *.
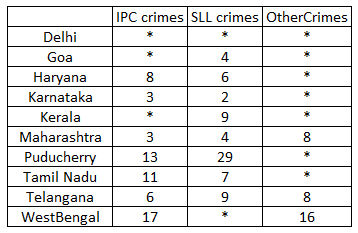
Question 4: What is the sum of the ranks of Delhi in the three categories of crimes?
4) Answer: 5
Solution:
The data can be tabulated as follows(approximately):
The data can be tabulated as follows(approximately):
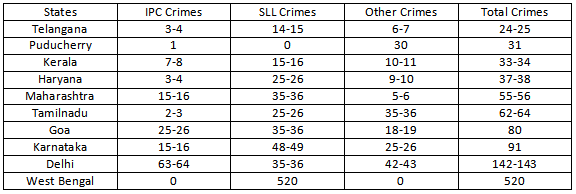
The rank of Delhi in IPC crimes should be 1 because the states which are not in table cannot crime more than that of Telangana which is 24-25.
Similarly Delhi Rank in Other crimes will be 1.
Now in SLL crimes clearly West Bengal has rank 1. It is given that Karnataka has rank 2. The rank 3 can go to either Goa, Delhi and Maharashtra but Goa and Maharashtra already have rank 4. So Delhi will have rank 3. Also no state outside of the table can be ranked 3 in SLL crimes as maximum number of crime should be less than that of Telangana(24-25). Here the number of SLL crimes is 35-36.
Hence the sum of the ranks = 1+3+1=5
Question 5: Which of the following is DEFINITELY true about the ranks of states/UT in the ‘other crimes’ category?
i) Tamil Nadu: 2
ii) Puducherry: 3
a) both i) and ii)
b) only ii)
c) neither i) , nor ii)
d) only i)
5) Answer (A)
Solution:
The data can be tabulated as follows(approximately):
From the table, the rank of Tamilnadu in other crimes is 2. The states which are not in the table will have crimes less than Telangana(i.e 24-25)
From the table the rank of Pudducherry in other crimes is 3.
Checkout: CAT Free Practice Questions and Videos
Question 6: In the two states where the highest total number of cases are registered, the ratio of the total number of cases in IPC crimes to the total number in SLL crimes is closest to
a) 3 : 2
b) 19 : 20
c) 11 : 10
d) 1 : 9
6) Answer (D)
Solution:
The data can be tabulated as follows(approximately):
The highest cases are registered in West Bengal and Delhi.
The total number of IPC crimes = 63-64
The total number of SLL crimes = 520+35-36 = 555-556
Hence the ratio = (63-64)/(555-556) = 0.11 (Approximately) = 1:9
Question 7: What is the rank of Kerala in the ‘IPC crimes’ category?
7) Answer: 5
Solution:
The data can be tabulated as follows(approximately):
Rank of Delhi in IPC crimes category = 1, The rank of Karnataka and Maharashtra is 3(from table), then the rank of Goa can only be 2.
The rank of Telangana is 6 which has less |IPC crimes than Kerala, which means the rank of Kerala can be less than or equal to 5.
Now, there are two states with 3 ranks, so there will be no rank 4, there can only be rank 5 which is Kerala.
Instructions
Answer the questions with the given information and the data.
The figures given below show the amount of work distribution (in operational hours) for a toy manufacturing company having manufacturing plants in Chennai and Kanpur. Each plant carries out six activities. Planned operational cost per hour of Chennai and Kanpur plants are ₹ 250 and %₹300 respectively. However, the actual operational cost per hour is ₹ 270 in Chennai and ₹ 315 in Kanpur.
Cost Difference (in %)=Absolute ((Actual Cost —- Planned Cost) / Planned Cost) x 100
.png)
Question 8: In how manyactivities plant in Chennai has higher planned operational hours as compared to plant in Kanpur ?
a) 1
b) 2
c) 3
d) 4
8) Answer (B)
Solution:

Chennai has more planned operational hours in Activity 2 and 6.
Question 9: Whichof following activities has maximum cost difference in Kanpur Plant ?
a) Activity 1
b) Activity 3
c) Activity 4
d) Activity 5
9) Answer (B)
Solution:

ACtivity 1 : 50/100 * 100 = 50%
Activity 3 : 100/150 *100= 66.6%
Activity 4 : 50/100 *100 = 50%
Activity 5 = 50/250 * 100 = 20%
Activity 3 is the correct answer.
Question 10: In how many activities plant in Chennai could meet at least 50% shortfall in the actual operational hours compared to planned operational hours of plant in Kanpur ?
a) 1
b) 2
c) 3
d) 4
10) Answer (B)
Solution:

In Activity 1, 50% shortfall of planned and actual in Kanpur is 25. Excess in chennai is 25. Hence this activity is counted.
In Activity 2 there is no shortfall
In Activity 3, the 50% shortfall is 50. Excess in chennai is 28. Hence this is incorrect
In Activity 4 and 5 there is no shortfall
In Activity 6 the 50% shortfall is 25. Excess in Chennai is 78. Hence, this activity is counted.
Question 11: Overall Cost difference in Chennai plant is approximately :
a) 39%
b) 41%
c) 65%
d) 70%
11) Answer (B)
Solution:

Planned cost in chennai = 1032 * 250=258000
Actual cost in chennai = 1350 * 270 = 364500
Cost difference = (106500/258000)*100 = 41%
Instructions
Answer the questions with the given information and the graph.
The analyst at a retail giant has modelled the consumer spending and consumer sentiment to prepare a strategy on product offers in the upcoming festive season. The data given in the figure are from last 10 years on 3 parameters namely, food spending (Food_Spend), style spending (Style_Spend), and sentiment index (Sentiment_Index). Study the figure below and answer the following questions :

Question 12: In which year, highest annual percentage change in StyleSpend is recorded ?
a) 2015
b) 2014
c) 2013
d) 2011
12) Answer (C)
Solution:
2015 = (450-300)/300 = 0.5
2014 = (650-300)/650 =0.54
2013 = (620-350)/350 = 0.77
2011 = (350-300)/350= 0.14
The highest percentage change is in the year 2013
Question 13: In which year, ratio of percentage annual change in Style_Spend to percentage annual change in Sentiment_Index is highest ?
a) 2011
b) 2012
c) 2014
d) 2017
13) Answer (C)
Solution:
2015 = (450-300)/300 = 0.5
2014 = (650-300)/650 =0.54
2013 = (620-350)/350 = 0.77
2011 Style spend = (350-300)/350= 0.14
2011 sentiment index = 140/250 = 0.56
2011 ratio = 1/4.
2012 Style spend = 50/300 = 1/6
2012 sentiment index = 140/390
Ratio 2012 = 0.06
2014 Style spend = (650-300)/650 =0.54
2014 sentiment index =360/750=0.48
Ratio = 1.1
2017 style spend = 100/450
2017 sentiment Index = 160/550
Ratio = 0.75
Option C is the correct answer.
Question 14: From the years mentioned below, in which year Food_Spend as a proportion of Style_Spend is lowest ?
a) 2012
b) 2013
c) 2015
d) 2016
14) Answer (B)
Solution:
2012 : 520/350 = 1.49
2013 : 700/650 = 1.07
2015 : 520/450 = 1.15
2016 : 520 / 450= 1.15
2013 is the lowest and hence it is the correct answer.
Question 15: From the years mentioned below, in which year total of Food_Spend and StyleSpend as a proportion of Sentiment_Index is lowest ?
a) 2011
b) 2013
c) 2016
d) 2017
15) Answer (C)
Solution:
2011 : 910/390= 2.33
2013: 1330/750= 1.77
2016: 970/550 = 1.75
2017: 960/370 = 2.6
Option C , 2016 is the correct answer.
Instructions
Based on the information answer the questions which follow.
The data was collected for an industry in order to analyse the impact and importance of select parameters. The Figure represents performance of the industry on select parameters which arc Fixed Capital. Materials, Value added and Number of Factories from the year 2008-09 to 2015-16. Total inputs – (Output — Value added). Table represents select performance indicators which are Output, Number of Workers and Emoluments from the year 2008-09 to 2015-16.
Figure: Industry Indicators from 2008-09 to 2015-16
Table: Industry Indicators from 2008-09 to to 2015-16
Question 16: For how many years annual percentage growth in fixed capital is greater than annual percentage growth in number of factories?
a) 3
b) 4
c) 5
d) 6
16) Answer (B)
Solution:

Annual percentage growth in fixed capital is greater than annual percentage growth in number of factories for four years, i.e. 2011-12, 2013-14, 2014-15 and 2015-16.
The answer is option B.
Question 17: In which of the following year Material as a proportion of ‘Total inputs’ is highest?
a) 2008 – 09
b) 2009 – 10
c) 2010 – 11
d) 2011 – 12
17) Answer (B)
Solution:

Material as a proportion of ‘Total inputs’ is highest in the year 2009-10.
The answer is option B.
Question 18: In which of the following year fixed capital per factory is lowest?
a) 2008 – 09
b) 2011 – 12
c) 2013 – 14
d) 2015 -16
18) Answer (B)
Solution:

Fixed capital per factory is lowest in the year 2011-12.
The answer is option B.
Question 19: In which of the following year annual growth rate in emoluments per worker is highest?
a) 2009 – 10
b) 2011 – 12
c) 2014 – 15
d) 2015 – 16
19) Answer (A)
Solution:
Emoluments per worker is highest in the year 2009-10.
The answer is option A.


