
Data Change Over a Period Questions for CAT
Data Change Over a Period is one of the key topics in the CAT LRDI Section. You can check out these CAT Data Cange Over a Period Questions from the CAT previous year papers. This article will look into some very important ‘Data Change Over a Period’ questions PDF (with solutions) for CAT. You can also download these CAT Data Change Over a Period questions with detailed solutions, which also include important tricks to solve these questions.
Download Data Change Over a Period Questions for CAT
Enroll for CAT 2022 Crash Course
Instructions
Read the information given below and answer the 3 associated questions.
During 2015-2019, the revenues of four companies P-S were as follows:

Question 1: Which of the given companies has seen the highest year-on-year growth (in percentage) in any single year during this five-year period?
a) P
b) There was a tie among multiple companies
c) R
d) Q
e) S
1) Answer (D)
Solution:
By noticing the table we can come to conclusion that either of P in 2018 or Q in 2017 must have highest yoy growth.
YOY of P in 2018=50/200 *100=25%
YOY of Q in 2017 = 40/140 *100 = 28.57%
Hence D is correct answer.
Instructions
Based on the information answer the questions which follow.
IBM is one of the most valuable technology brand in the world. Visualizing the trends, IBM has added and dropped business segments across years. For example, “Technology Services and Cloud Platforms (TSCP)” which started in 2015 only, generated a revenue of approximately 34280 million U.S. Dollars in 2017. Table shows the Global Revenue generated by IBM in nine different segments of its business from 2010 to 2017 in millions USD.
IBM’s Golbal Revenue from 2010 to 2017 (in millions U.S. Dollars)

TSCP-Technology Services & Cloud Platforms. CS-Cognitive Solutions, GBS-Global Business Services, SYS-Systems, GF-Global Financing, Other. SOFT-Software. GTS-Global Technology Services and S&T-Systems and Technology
Question 2: By how much is ratio of percentage of ‘revenue from Global Business Services’ to ‘Total Revenue’ lower than ratio of percentage of ‘revenue from Cognitive Solutions’ to ‘Total Revenue’ for the year 2016?
a) 1
b) 2
c) 3
d) 5
2) Answer (B)
Solution:
Difference = $\ \ \frac{\ 18190-16700}{79920}\times\ 100\ =\ 1.86\%\ \approx\ 2\%$
The answer is option B.
Question 3: The profit booked by IBM in year 2012 is USD 49 billion. Considering equal percentage profit margins across all segments, then approximate profit made by ‘Systems and Technology’ in millions USD is
a) 8200
b) 8500
c) 8700
d) 8900
3) Answer (A)
Solution:
Revenue in 2012 = 18570 + 2010 + 580 + 25450 + 40240 + 17670 = 104520 = 104.52 billion
Profit % = $\frac{49}{104.52-49}\times\ 100\ =\ 88.26\%\ $
Let the profit made by Systems and Technology in 2012 be ‘x’
$\frac{x}{17670-x}=\frac{49}{55.52}$
x = 8283.87
The answer is option A.
Question 4: Which segment has earned third highest cumulative revenue in the time period 2010-2017?
a) Global Business Services
b) Software
c) Global Technology Services
d) Systems and Technology
4) Answer (B)
Solution:
TSCP – 35140 + 35240 + 34280 = 104760
CS – 17840 + 18190 + 18450 = 54480
GBS – 18220 + 19280 + 18570 + 18400 + 17800 + 17160 + 16700 + 16350 = 142480 – 2nd
SYS – 9550 + 7710 + 8190 = 25450
GF – 2240 + 2100 + 2010 + 2020 + 2000 + 1840 + 1690 +1700 = 15600
Others – least – 3710
SOFT – 22490 + 24940 + 25450 + 25930 + 25400 = 124210 – 3rd
GTS – 38200 + 40880 + 40240 + 38550 + 37100 = 194970 – 1st
S&T – 17970 + 18990 + 17670 + 14370 + 10000 = 79000
Software has earned third highest cumulative revenue in the time period 2010-2017.
The answer is option B.
Question 5: For the year 2017, if the revenue in different segments is represented on a pie-chart, what sector angle would be represented by ‘Global Business Services (GBS)’?
a) 75 Degree
b) 85 Degree
c) 80 Degree
d) 70 Degree
5) Answer (A)
Solution:
Total revenue in 2017 = 34280 + 18450 + 16350 + 8190 + 1700 + 170 = 79140
Angle subtended by GBS = $\frac{16350}{79140}\times\ 360^{\circ\ }$ = 74.37 $\approx\ $ 75
The answer is option A.
Instructions
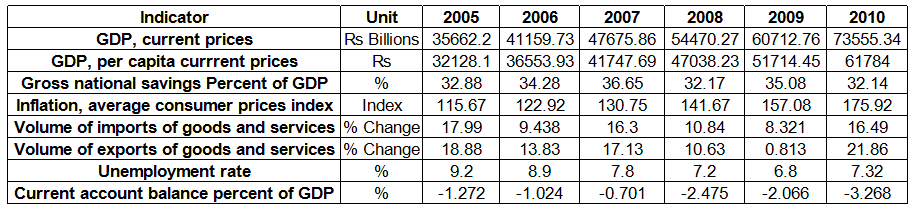
*per capita GDP is arrived by dividing GDP by population.
Checkout: CAT Free Practice Questions and Videos
Question 6: What was the approximate number of unemployed persons in 2006?
a) 100 million
b) 102 million
c) 98 million
d) 105 million
e) 104 million
6) Answer (A)
Solution:
Population = GDP/GDP per capita
In 2006, GDP = Rs.41159.73 billion
GDP per capita = Rs. 36,553.93
=> Population = 41159.73*1000/36553.93
= 1126 million.
From the table, we can see that 8.9% of the total population was unemployed in 2006.
=> Number of unemployed people = 0.089*1126 = 100 million (approx)
Therefore, option A is the right answer.
Question 7: Read the statements given below:
l.Exports were more than imports in 2006
2.Imports were more than exports in 2009
3.Exports increased at faster rate than imports during the period 2005 to 2010
Which of the above statements is necessarily true?
a) 1 and 2
b) 1, 2 and 3
c) 3 only
d) 2 only
e) 1 only
7) Answer (C)
Solution:
The table provides details only regarding the % change in the imports and exports. We do not have any detail regarding the base value. Therefore, we cannot find out the absolute values and hence, statements 1 and 2 cannot be verified.
The percentage change of exports and imports over the given period can be found out. Among the given options, option C is the only viable option now. Since none of the above is not present among the options, option C must be the right answer.
To actually compare the growth rate of export and import. we can multiply the rates to find the net change and then compare.
Question 8: What is the ratio of the current account balance in 2010 to the current account balance in 2005?
a) 0.35
b) 4.56
c) 5.01
d) 2.57
e) 5.30
8) Answer (E)
Solution:
Current account balance = Current account balance percentage of GDP*GDP
Current account balance in 2010 = 3.268% of 73555.34 = 2403.7885
Current account balance in 2005 = 1.272% of 35662.2 = 453.623
Ratio = 2403.7885/453.623 = 5.3 (approximately).
Therefore, option E is the right answer.
Instructions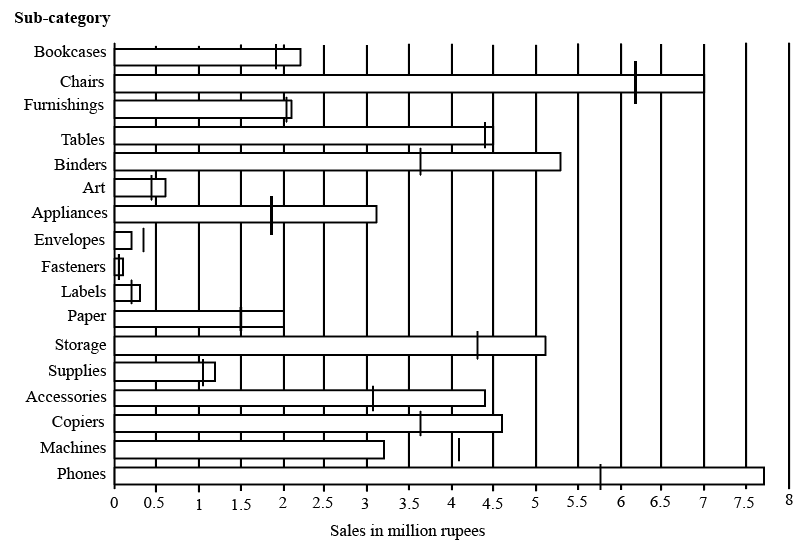
The horizontal bars in the above diagram represent 2020 aggregate sales (in ₹ million) of a company for the different subcategories of its products. The top four product subcategories (Bookcases, Chairs, Furnishings, Tables) belong to furniture product category; the bottom four product subcategories (Accessories, Copiers, Machines, Phones) belong to the technology product category while all other product subcategories belong to the office supply product category. For each of the product subcategories, there is a vertical line indicating the sales of the corresponding subcategory in 2019.
Question 9: The improvement index for a category is the maximum percentage increase in sales from 2019 to 2020 among any of its subcategories. The correct order of categories in increasing order of this improvement index is
a) furniture, technology, office supply
b) technology, furniture, office supply
c) office supply, technology, furniture
d) office supply, furniture, technology
9) Answer (A)
Solution:
The improvement index for a category is the maximum percentage increase in sales from 2019 to 2020 among any of its subcategories.
Hence based on the information provided in the tabular data we need to look for the different subcategories where the rise in sales from 2019 to 2020 is higher.
Based on the visual data :
In the furniture category :
Bookcases and Chairs have a relatively high percentage increase :
Books cases: 1.9 million to 2.2 million ( 15.7 percent increase )
Chairs: 6.2 million to 7 million ( 12.9 percent increase)
In the office supply category :
Binders and Appliances have a relatively high percentage increase :
Binders: 3.6 million to 5.3 million (47 percent increase )
Appliances: 1.9 million to 3.15 million ( 65.7 percent increase)
In technology product category :
Accessories: 3.1 to 4.4 million. (41.9 percent increase)
Phones: 5.8 million to 7.7 million ( 32.7 percent increase)
Hence among the categories :
The highest increase among them is in the order :
Furniture < Technology product < office supply.
Question 10: How many subcategories had sales of ₹ 4 million or more in 2019 and registered an increase in sales in excess of 25% in 2020?
10) Answer: 1
Solution:
The number of subcategories had sales of ₹ 4 million or more in 2019 and registered an increase in sales in excess of 25% in 2020 :
The subcategories with more than 4 million in sales in 2019 are :
Chairs: 6.2 million in 2019 and 7 million in 2020. ( For a 25 percent increase the sales must be at least 7.8 million and hence fails)
Tables: 4.4 million in 2019 and 4.5 million in 2020. ( For a 25 percent increase the sales must be at least 5.5 million and hence fails)
Storage: 4.3 million sales in 2019 and 5.1 million in 2020. ( For a 25 percent increase the sales must be at least 5.4 and hence fails)
Phones: 5.75 million in 2019 and 7.5 million in 2020. ( An increase of 30.5 percent)
Hence only one subcategory satisfies the condition.
Question 11: The percentage increase in sales in Furniture category from 2019 to 2020 is closest to
a) 20%
b) 8%
c) 25%
d) 1%
11) Answer (B)
Solution:
The percentage increase in sales in the furniture category from 2019 to 2020 are :
Bookcases: 1.9 million in 2019 and 2.2 million in 2020.
Chairs: 6.2 million in 2019 and 7 million in 2020.
Furnishings: 2.05 million in 2019 and 2.1 million in 2020.
Tables: 4.4 million in 2019 and 4.5 million in 2020.
Hence the percentage increase is given by :
$\frac{\left(\left(2.2+7+2.1+4.5\right)-\left(1.9+6.2+2.05+4.4\right)\right)}{1.9+6.2+2.05+4.4}$
$\frac{\left(15.8-14.55\right)}{14.55}\cdot100\ =\ \frac{125}{14.55}=\ 8.53\%$
Question 12: The total sales (in ₹ million) in 2019 from products in office supplies category is closest to
a) 18.0
b) 16.5
c) 13.5
d) 12.5
12) Answer (C)
Solution:
The total sales from products in the office supply category in 2019 is :
Sum of sales of :
Binders: 3.6 million
Art : 0.4 million.
Appliances: 1.9 million
Envelops: 0.3 million
Fasteners: 0.1 million
Labels: 0.2 million
Paper = 1.5 million.
Storage: 4.3 million.
Supplies: 1.1 million.
The sum of sales of these products = 3.6+0.4+1.9+0.3+0.1+0.2+1.5+4.3+1.1 = 13.4 million.
The closest among the option is 13.5 million.
Instructions
Read the information given below and answer the 3 associated questions.
During 2015-2019, the revenues of four companies P-S were as follows:
Question 13: It was discovered later that one of the companies misreported its revenue of one of the years. If the misreported revenue is replaced by the correct revenue, the revenues of that company over the five-year period will be in an arithmetic progression. The company that misreported its revenue was
a) R or S
b) S only
c) P or R
d) P or S
e) P only
13) Answer (D)
Solution:
If P’s revenue in 2018 is 225 and S’s revenue in 2016 is 160 then their revenues will be in A.P.


