 PDF")
Every year around 5 to 10 questions are asked from Data interpretation topic. These questions are in general easy and can be answered very quickly through practice. In this blog we are providing tables based data interpretation question for practice. Try this solved DI problems of Bank clerk before viewing the given solution.
IBPS Clerk Data Interpretation Questions:
Download IBPS Clerk Data Interpretation Questions
75 IBPS Clerk Mocks – just Rs.199
IBPS Clerk Free Mock Test-2018
Download all IBPS clerk questions and answers PDF.
Practice IBPS Clerk Computer Awareness online tests and download all GK ebooks for Banking exams
Instructions (1 – 5):
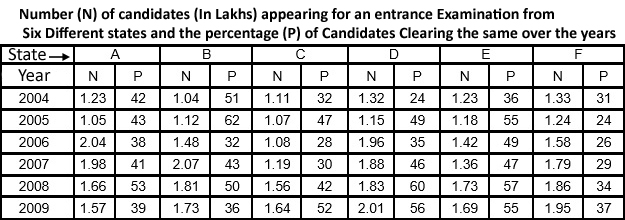
Study the following table carefully to answer the question that follow:
Question 1:
What is the ratio of the total number of candidates clearing the entrance exam from State B in the year 2004 to that of those clearing the entrance exam from State C in the same year?
a) 221:148
b) 218:143
c) 148:221
d) 143:218
e) None of these
Question 2:
In which year did the highest number of candidates clear the entrance exam from state D ?
a) 2008
b) 2006
c) 2009
d) 2007
e) None of these
Question 3:
What is the number of candidates not clearing the entrance exam from State A in the year 2007 ?
a) 186820
b) 11682
c) 1868200
d) 116820
e) None of these
Download General Knowledge PDF
Question 4:
What is the total number of candidates clearing the entrance exam from states E and F together in the year 2006 ?
a) 16160
b) 110660
c) 1.1066
d) 1106600
e) None of these
Question 5:
What is the average number of candidates appearing for the entrance exam from state D in the years 2007,2008 and 2009 together ?
a) $$1907\frac{2}{3}$$
b) $$18666\frac{1}{3}$$
c) $$1866\frac{1}{3}$$
d) $$190666\frac{2}{3}$$
e) None of these
Instructions (6 – 10):
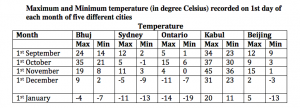
Directions: Study the table carefully to answer the questions that follow. maximum and Minimum temperature (in degree Celsius) recorded on 1st day of each month of five different cities
Question 6:
What is the difference between the maximum temperature of Ontario on 1st November and the minimum temperature of Bhuj on 1st January?
a) 3 °C
b) 18 ° C
c) 15 °C
d) 9 ° C
e) 11 ° C
Question 7:
In which month respectively is the maximum temperature of Kabul the second highest and the minimum temperature of Sydney the lowest?
a) 1st October and 1st January
b) 1st October and 1st November
c) 1st December and 1st January
d) 1st September and 1st January
e) 1st December and 1st September
Question 8:
In which month (on 1st day) is the difference between maximum temperature and minimum temperature of Bhuj the second highest?
a) 1st September
b) 1st October
c) 1st November
d) 1st December
e) 1st January
Question 9:
What is the average maximum temperature of Beijing over all the months together?
a) 8.4 °C
b) 9.6 ° C
c) 7.6 °C
d) 9.2 ° C
e) 8.6 ° C
Question 10:
What is the ratio of the minimum temperature of Beijing on 1st September to the maximum temperature of Ontario on 1st October?
a) 3 : 4
b) 3 : 5
c) 4 : 5
d) 1 : 5
e) 1 : 4
Answers and Solutions for IBPS Clerk Data Interpretation Questions:
Solutions:
1) Answer (A)
Total number of candidates that cleared the exam in 2004 from State B = Total candidates that appeared * percentage cleared = 1.04 lakhs* 51% = 53,040
Total number of candidates that cleared the exam in 2004 from State C = 1.11 lakhs * 32% = 35,520
So, the ratio = 53,040 : 35, 520 = 221:148
2) Answer (C)
The number of candidates clearing the exam = number of candidates appearing for the exam * percentage clearing the exam.
For the number of cleared candidates to be high, the number of candidates appearing should be high as well as the percentage clearing the exam as well.
We can observe that both these numbers are considerably high for 2009. We can calculate to find out that 2009 has the highest number of candidates that cleared the exam.
The number of candidates clearing the exam in 2009 = 2.01 lakhs * 56% = 1,12,560
3) Answer (D)
Number of candidates appearing for the exam from A in 2007 = 1.98 lakhs
Percentage cleared = 41%
Percentage failed to clear = 1- 41%= 59%
So, number that failed to clear 1.98 lakhs * 59% = 1,16,820
4) Answer (B)
Number of candidates clearing the exam in 2006 from E = Number of candidates appearing * percentage that cleared = 1.42 lakhs * 49% = 69,580
Number of candidates clearing the exam in 2006 from F = 1.58 lakhs * 26% = 41,080
Total = 69, 580 + 41, 080 = 1,10,660
5) Answer (D)
The average for the 3 years = (1.88 + 1.83 + 2.01 lakhs)/ 3 = 1.9067 lakhs
6) Answer (E)
Max. temperature in Ontario on 1st November = 4
Min. temperature in Bhuj on 1st January = -7
So, difference = 11
100 Free GK tests for Banking Download App
7) Answer (A)
Kabul has the second highest maximum temperature on 1st October.
The minimum temperature in Sydney is the lowest on 1st January.
So, option a) is the correct answer.
8) Answer (C)
The differences between the maximum and minimum temperatures in Bhuj are as follows:
1st September – 10
1st October – 14
1st November – 11
1st December – 7
1st January – 3
So, the second highest difference is on 1st November.
9) Answer (E)
Required average temperature = (12+9+15+2+5)/5 = 43/5 = 8.6
10) Answer (B)
Min. temperature in Beijing on 1st September = 9
Max. temperature in Ontario on 1st October = 15
So, required ratio = 9:15 = 3:5
This data interpretation questions are previous solved papers of IBPS Clerk, so practicing this questions will definitely help you.


