
As we know, CAT has moved away from the traditional LRDI sets, it’s imperative to practice the non-traditional type of sets. The sets that are appearing are more logic-based (and relatively less data-intensive in nature). You can check out the CAT DILR questions based on CAT Previous year’s papers. In this article, we will look into some important DILR questions for CAT with solutions PDF. These are good sources for practising LRDI sets including logical DI questions. Click on the below link to download the PDF
Download DILR Questions for CAT PDF
Enroll for CAT 2022 Online Course
Instructions
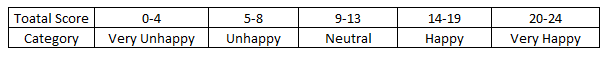
Simple Happiness index (SHI) of a country is computed on the basis of three, parameters: social support (S),freedom to life choices (F) and corruption perception (C). Each of these three parameters is measured on a scale of 0 to 8 (integers only). A country is then categorised based on the total score obtained by summing the scores of all the three parameters, as shown in the following table:
Following diagram depicts the frequency distribution of the scores in S, F and C of 10 countries – Amda, Benga, Calla, Delma, Eppa, Varsa, Wanna, Xanda,Yanga and Zooma:
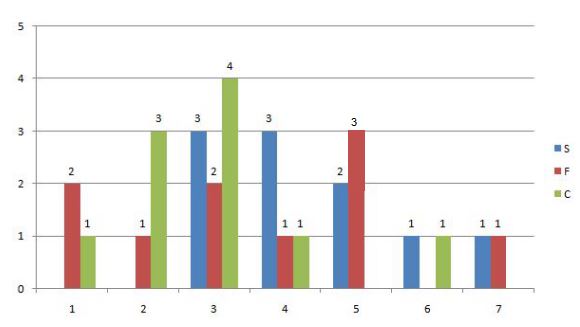
Further, the following are known.
1. Amda and Calla jointly have the lowest total score, 7, with identical scores in all the three parameters.
2. Zooma has a total score of 17.
3. All the 3 countries, which are categorised as happy, have the highest score ln exactly one parameter.
Question 1: What is Amda’s score in F?
1) Answer: 1
Solution:
The frequency distribution is:
S: 3,3,3,4,4,4,5,5,6,7
F: 1,1,2,3,3,4,5,5,5,7
C: 1,2,2,2,3,3,3,3,4,6
or
S: 3,3,3,4,4,4,5,5,6,7
F: 1,1,2,3,3,4,5,5,5,7
C: 1,2,2,2,3,3,3,3,4,6
Given Amda and Cadella score is 7 each with identical in all parameters. So it can score either 3,1,3 in S,F,C respectively or 4,1,2 in S,F,C respectively. In both the cases, its score in F is 1.
Question 2: What is Zooma’s score in S?
2) Answer: 6
Solution:
The frequency distribution is:
S: 3,3,3,4,4,4,5,5,6,7
F: 1,1,2,3,3,4,5,5,5,7
C: 1,2,2,2,3,3,3,3,4,6
or
S: 3,3,3,4,4,4,5,5,6,7
F: 1,1,2,3,3,4,5,5,5,7
C: 1,2,2,2,3,3,3,3,4,6
Zooma(Z) has a total score of 17 (comes under happy category), and other 2 countries, which are categorized as happy, have the highest score in exactly one parameter.
Suppose the other two countries are P and Q
Z have two possibilities for S, F, C : (6,7,4) & (6,5,6)
All the other cases are negated because “All the 3 countries, which are categorised as happy, have the highest score ln exactly one parameter.”
For Example : 7,7,3 is not possible because 7 being the highest score is there in two parameters.
So, it scored 6 in S in both the cases.
Question 3: Benga and Delma, two countries categorized as happy, are tied with the same total score. What is the
maximum score they can have?
a) 14
b) 15
c) 16
d) 17
3) Answer (B)
Solution:
S: 3,3,3,4,4,4,5,5,6,7
F: 1,1,2,3,3,4,5,5,5,7
C: 1,2,2,2,3,3,3,3,4,6
Benga and Delma, two countries categorized as happy, are tied with the same total score.
The best numbers remaining are 7,5,6 which adds upto 18, If Benga scores 18, then Delma can’t score 18.
Similarly both can’t score 17 and 16. Both can score 15 and their distribution will be:
Benga: 7,5,3
Delma: 4,5,6 or 5,4,6
Question 4: If Benga scores 16 and Delma scores 15, then what is the maximum number of countries with a score of 13?
a) 0
b) 1
c) 2
d) 3
4) Answer (B)
Solution:
S: 3,3,3,4,4,4,5,5,6,7
F: 1,1,2,3,3,4,5,5,5,7
C: 1,2,2,2,3,3,3,3,4,6
Given that Benga scores 16, and Delma scores 15.
The possibility is Benga: 5,5,6 and Delma: 7,5,3
If Benga’s distribution is 7,3,6 then Delma can’t score 15.
Strike off those numbers.
S: 3,3,3,4,4,4,5,5,6,7
F: 1,1,2,3,3,4,5,5,5,7
C: 1,2,2,2,3,3,3,3,4,6
We have to maximum number of countries with score 13. This score does not comes under the category of happy. So to score 13, the distribution can be 5,5,3. Hence, maximum 1 country is possible.
Instructions
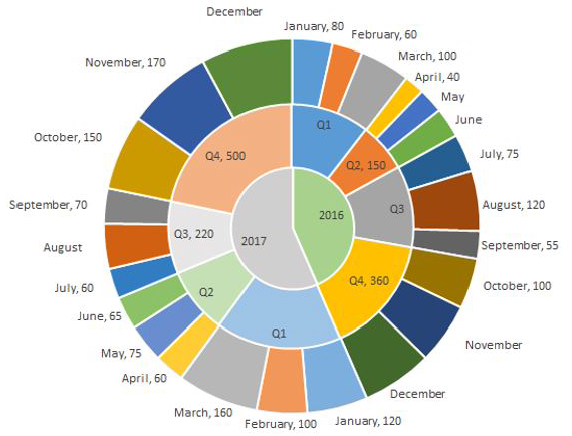
The multi-layered pie-chart below shows the sales of LED television sets for a big retail electronics outlet during 2016 and 2017. The outer layer shows the monthly sales during this period, with each label showing the month followed by sales figure of that month. For some months, the sales figures are not given in the chart. The middle-layer shows quarterwise aggregate sales figures (in some cases, aggregate quarter-wise sales numbers are not given next to the quarter). The innermost layer shows annual sales. It is known that the sales figures during the three months of the second quarter (April, May, June) of 2016 form an arithmetic progression, as do the three monthly sales figures in the fourth quarter (October, November, December) of that year.
Question 5: What is the percentage increase in sales in December 2017 as compared to the sales in December 2016?
a) 38.46
b) 22.22
c) 28.57
d) 50.00
5) Answer (C)
Solution:
We have been given details about the quarterly sales figures. Also, we have been given details about the sales figures every month. Some of the data are missing and some additional conditions have been given in the question. Let us try to complete the pie chart as much as possible with the data available to us.
It is known that the sales figures during the three months of the second quarter (April, May, June) of 2016 form an arithmetic progression.
We know that the sales in April is 40.
Let the sales in May be 40+x and the sales in June be 40+2x.
We know that the total sales in Q2 is 150.
=> 40 + 40 + x + 40 + 2x = 150
3x = 30
x = 10
Therefore, sales in May 2016 = 40 + 10 = 50
Sales in June 2016 = 40 + 20 = 60
Similarly, it has been given that the sales in October, November, and December 2016 form an arithmetic progression.
Sales in October = 100
Sales in Q4 = 360
Let the sales in November be 100+y and the sales in December be 100+2y.
100 + 100 + y + 100 + 2y = 360
300 + 3y = 360
=> y = 20
Sales in November 2016 = 120 and Sales in December 2016 = 140
Sales in Q1 of 2016 = Sum of the sales in the months of January, February, and March 2016
= 80 + 60 + 100
= 240
Sales in Q3 of 2016 = Sum of the sales in the months of July, August, and September 2016
= 75 + 120 + 55
= 250
Sales in Q1 of 2017 = 120 + 100 + 160 = 380
Sales in Q2 of 2017 = 65 + 75 + 60 = 200
We know that sales in Q3 of 2017 = 220
Let the sales in August of 2017 be ‘a’.
60 + 70 + a = 220
=> a = 90
Sales in August 2017 = 90
We know that sales in Q4 of 2017 = 500
Let the sales in December of 2017 be ‘d’.
150 + 170 + d = 500
=> d = 180
Sales in December 2017 = 180

Sales in December 2016 = 140
Sales in December 2017 = 180
Percentage change = (180-140)/140 = 40/140 = 28.57%
Therefore, option C is the right answer.
Question 6: In which quarter of 2017 was the percentage increase in sales from the same quarter of 2016 the highest?
a) Q2
b) Q1
c) Q4
d) Q3
6) Answer (B)
Solution:
We have been given details about the quarterly sales figures. Also, we have been given details about the sales figures every month. Some of the data are missing and some additional conditions have been given in the question. Let us try to complete the pie chart as much as possible with the data available to us.
It is known that the sales figures during the three months of the second quarter (April, May, June) of 2016 form an arithmetic progression.
We know that the sales in April is 40.
Let the sales in May be 40+x and the sales in June be 40+2x.
We know that the total sales in Q2 is 150.
=> 40 + 40 + x + 40 + 2x = 150
3x = 30
x = 10
Therefore, sales in May 2016 = 40 + 10 = 50
Sales in June 2016 = 40 + 20 = 60
Similarly, it has been given that the sales in October, November, and December 2016 form an arithmetic progression.
Sales in October = 100
Sales in Q4 = 360
Let the sales in November be 100+y and the sales in December be 100+2y.
100 + 100 + y + 100 + 2y = 360
300 + 3y = 360
=> y = 20
Sales in November 2016 = 120 and Sales in December 2016 = 140
Sales in Q1 of 2016 = Sum of the sales in the months of January, February, and March 2016
= 80 + 60 + 100
= 240
Sales in Q3 of 2016 = Sum of the sales in the months of July, August, and September 2016
= 75 + 120 + 55
= 250
Sales in Q1 of 2017 = 120 + 100 + 160 = 380
Sales in Q2 of 2017 = 65 + 75 + 60 = 200
We know that sales in Q3 of 2017 = 220
Let the sales in August of 2017 be ‘a’.
60 + 70 + a = 220
=> a = 90
Sales in August 2017 = 90
We know that sales in Q4 of 2017 = 500
Let the sales in December of 2017 be ‘d’.
150 + 170 + d = 500
=> d = 180
Sales in December 2017 = 180
Among the given 4 options, we have to find the quarter in which the increase in sale from the previous quarter was the highest.
Q2:
Sales in 2017 = 200
Sales in 2016 = 150
Q1:
Sales in 2017 = 380
Sales in 2016 = 240
Q3:
Sales in 2017 = 220
Sales in 2016 = 250
Q4:
Sales in 2017 = 500
Sales in 2016 = 360
We can eliminate Q3 since the sales has decreased.
Growth in Q2 sales = 50/150 = 1/3 = 33.33%
Growth in Q1 sales = (380-240)/240 = 140/240 = 58.33%
Growth in Q4 sales = (500-360)/360 = 140/360
140/240 > 140/360
Therefore, Q1 has recorded the highest growth in sales and hence, option B is the right answer.
Question 7: During which quarter was the percentage decrease in sales from the previous quarter’s sales the highest?
a) Q2 of 2017
b) Q4 of 2017
c) Q2 of 2016
d) Q1 of 2017
7) Answer (A)
Solution:
We have been given details about the quarterly sales figures. Also, we have been given details about the sales figures every month. Some of the data are missing and some additional conditions have been given in the question. Let us try to complete the pie chart as much as possible with the data available to us.
It is known that the sales figures during the three months of the second quarter (April, May, June) of 2016 form an arithmetic progression.
We know that the sales in April is 40.
Let the sales in May be 40+x and the sales in June be 40+2x.
We know that the total sales in Q2 is 150.
=> 40 + 40 + x + 40 + 2x = 150
3x = 30
x = 10
Therefore, sales in May 2016 = 40 + 10 = 50
Sales in June 2016 = 40 + 20 = 60
Similarly, it has been given that the sales in October, November, and December 2016 form an arithmetic progression.
Sales in October = 100
Sales in Q4 = 360
Let the sales in November be 100+y and the sales in December be 100+2y.
100 + 100 + y + 100 + 2y = 360
300 + 3y = 360
=> y = 20
Sales in November 2016 = 120 and Sales in December 2016 = 140
Sales in Q1 of 2016 = Sum of the sales in the months of January, February, and March 2016
= 80 + 60 + 100
= 240
Sales in Q3 of 2016 = Sum of the sales in the months of July, August, and September 2016
= 75 + 120 + 55
= 250
Sales in Q1 of 2017 = 120 + 100 + 160 = 380
Sales in Q2 of 2017 = 65 + 75 + 60 = 200
We know that sales in Q3 of 2017 = 220
Let the sales in August of 2017 be ‘a’.
60 + 70 + a = 220
=> a = 90
Sales in August 2017 = 90
We know that sales in Q4 of 2017 = 500
Let the sales in December of 2017 be ‘d’.
150 + 170 + d = 500
=> d = 180
Sales in December 2017 = 180
Q2 of 2017:
Sales in Q2 of 2017 = 200
Sales in Q1 of 2017 = 380
% decrease = 180/380
Q4 of 2017:
We can eliminate this option since the sales has increased in Q4 of 2017 as compared to the previous quarter.
Q2 of 2016:
Sales in Q2 of 2016 = 150
Sales in Q1 of 2016 = 240
% decrease = 90/240
Q1 of 2017:
Sales in Q1 of 2017 has increased as compared to sales in the previous quarter. We can eliminate this option as well.
180/380 is very close to 50%. 90/240 is closer to 33.33%. Therefore, option A is the right answer.
Question 8: During which month was the percentage increase in sales from the previous month’s sales the highest?
a) March of 2017
b) October of 2017
c) March of 2016
d) October of 2016
8) Answer (B)
Solution:
We have been given details about the quarterly sales figures. Also, we have been given details about the sales figures every month. Some of the data are missing and some additional conditions have been given in the question. Let us try to complete the pie chart as much as possible with the data available to us.
It is known that the sales figures during the three months of the second quarter (April, May, June) of 2016 form an arithmetic progression.
We know that the sales in April is 40.
Let the sales in May be 40+x and the sales in June be 40+2x.
We know that the total sales in Q2 is 150.
=> 40 + 40 + x + 40 + 2x = 150
3x = 30
x = 10
Therefore, sales in May 2016 = 40 + 10 = 50
Sales in June 2016 = 40 + 20 = 60
Similarly, it has been given that the sales in October, November, and December 2016 form an arithmetic progression.
Sales in October = 100
Sales in Q4 = 360
Let the sales in November be 100+y and the sales in December be 100+2y.
100 + 100 + y + 100 + 2y = 360
300 + 3y = 360
=> y = 20
Sales in November 2016 = 120 and Sales in December 2016 = 140
Sales in Q1 of 2016 = Sum of the sales in the months of January, February, and March 2016
= 80 + 60 + 100
= 240
Sales in Q3 of 2016 = Sum of the sales in the months of July, August, and September 2016
= 75 + 120 + 55
= 250
Sales in Q1 of 2017 = 120 + 100 + 160 = 380
Sales in Q2 of 2017 = 65 + 75 + 60 = 200
We know that sales in Q3 of 2017 = 220
Let the sales in August of 2017 be ‘a’.
60 + 70 + a = 220
=> a = 90
Sales in August 2017 = 90
We know that sales in Q4 of 2017 = 500
Let the sales in December of 2017 be ‘d’.
150 + 170 + d = 500
=> d = 180
Sales in December 2017 = 180
March of 2017:
Sales in March of 2017 = 160
Sales in February of 2017 = 100
% increase = 60/100 = 60%
October of 2017:
Sales in October of 2017 = 150
Sales in September of 2017 = 70
As we can see, the sales has increased by more than 100%.
March of 2016:
Sales in March of 2016 = 100
Sales in February of 2016 = 60
% increase in sales is less than 100%.
October of 2016:
Sales in October of 2016 = 100
Sales in September of 2016 = 55
% increase is less than 100%
As we can see, the percentage increase in sale as compared to the previous month was highest in October of 2017 among the given options. Therefore, option B is the right answer.
Instructions
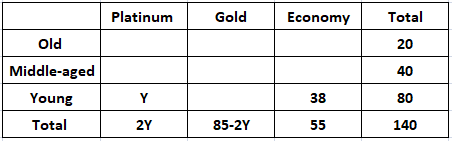
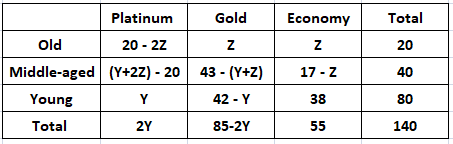
Each visitor to an amusement park needs to buy a ticket. Tickets can be Platinum, Gold, or Economy. Visitors are classified as Old, Middle-aged, or Young. The following facts are known about visitors and ticket sales on a particular day:
1. 140 tickets were sold.
2. The number of Middle-aged visitors was twice the number of Old visitors, while the number of Young visitors was twice the number of Middle-aged visitors.
3. Young visitors bought 38 of the 55 Economy tickets that were sold, and they bought half the total number of Platinum tickets that were sold.
4. The number of Gold tickets bought by Old visitors was equal to the number of Economy tickets bought by Old visitors.
Question 9: If the number of Old visitors buying Platinum tickets was equal to the number of Middle-aged visitors buying Platinum tickets, then which among the following could be the total number of Platinum tickets sold?
a) 34
b) 36
c) 38
d) 32
9) Answer (D)
Solution:
Let ‘x’ be the the number of Old visitors. Then, the number of middle-aged visitors = 2x.
Also, the number of Young visitors = 2*2x = 4x
$\Rightarrow$ x+2x+4x = 140
$\Rightarrow$ x = 20
It is given that total of 55 Economy tickets were sold out.
It is given that Young visitors half the total number of Platinum tickets that were sold.
Let ‘Y’ be the number of Platinum tickets bought by the Young visitors.
Then,the number of Platinum tickets sold = 2Y.
Consequently, we can say that the number of Gold tickets sold = 140 – 55 – 2Y = 85 – 2Y.
Let us assume that ‘Z’ is the number of Economy tickets bought by the Old visitors. It is given that the number of Gold tickets bought by Old visitors was equal to the number of Economy tickets bought by Old visitors.
It is given that the number of Old visitors buying Platinum tickets was equal to the number of Middle-aged visitors buying Platinum tickets.
20 – 2Z = (Y+2Z) – 20
Y + 4Z = 40
2Y + 8Z = 80
2Y = 80 – 8Z
We can see that Z can take only integer values. Therefore, we can say that the the total number of Platinum tickets sold will be a multiple of 8. Hence, option D is the correct answer.
Question 10: If the number of Old visitors buying Platinum tickets was equal to the number of Middle-aged visitors buying Economy tickets, then the number of Old visitors buying Gold tickets was
10) Answer: 3
Solution:
Let ‘x’ be the the number of Old visitors. Then, the number of middle-aged visitors = 2x.
Also, the number of Young visitors = 2*2x = 4x
$\Rightarrow$ x+2x+4x = 140
$\Rightarrow$ x = 20
It is given that total of 55 Economy tickets were sold out.
It is given that Young visitors half the total number of Platinum tickets that were sold.
Let ‘Y’ be the number of Platinum tickets bought by the Young visitors.
Then,the number of Platinum tickets sold = 2Y.
Consequently, we can say that the number of Gold tickets sold = 140 – 55 – 2Y = 85 – 2Y.
Let us assume that ‘Z’ is the number of Economy tickets bought by the Old visitors. It is given that the number of Gold tickets bought by Old visitors was equal to the number of Economy tickets bought by Old visitors.
It is given that the number of Old visitors buying Platinum tickets was equal to the number of Middle-aged visitors buying Economy tickets.
20 – 2Z = 17 – Z
$\Rightarrow$ Z = 3
Therefore, we can say that the number of Old visitors buying Gold tickets = 3
Checkout: CAT Free Practice Questions and Videos
Question 11: If the number of Old visitors buying Gold tickets was strictly greater than the number of Young visitors buying Gold tickets, then the number of Middle-aged visitors buying Gold tickets was
11) Answer: 0
Solution:
Let ‘x’ be the the number of Old visitors. Then, the number of middle-aged visitors = 2x.
Also, the number of Young visitors = 2*2x = 4x
$\Rightarrow$ x+2x+4x = 140
$\Rightarrow$ x = 20
It is given that total of 55 Economy tickets were sold out.
It is given that Young visitors half the total number of Platinum tickets that were sold.
Let ‘Y’ be the number of Platinum tickets bought by the Young visitors.
Then,the number of Platinum tickets sold = 2Y.
Consequently, we can say that the number of Gold tickets sold = 140 – 55 – 2Y = 85 – 2Y.
Let us assume that ‘Z’ is the number of Economy tickets bought by the Old visitors. It is given that the number of Gold tickets bought by Old visitors was equal to the number of Economy tickets bought by Old visitors.
It is given that the number of Old visitors buying Gold tickets was strictly greater than the number of Young visitors buying Gold tickets.
Z > 42 – Y
$\Rightarrow$ Z + Y > 42 … (1)
The number of Middle-aged visitors buying Gold tickets = 43 – (Y+Z)
Since (Y+Z) > 42, then We can say that (Y+Z)$_{min}$ = 43.
Hence, the number of Middle-aged visitors buying Gold tickets = 43 – 43 = 0
Question 12: Which of the following statements MUST be FALSE?
a) The numbers of Gold and Platinum tickets bought by Young visitors were equal
b) The numbers of Middle-aged and Young visitors buying Gold tickets were equal
c) The numbers of Old and Middle-aged visitors buying Platinum tickets were equal
d) The numbers of Old and Middle-aged visitors buying Economy tickets were equal
12) Answer (D)
Solution:
Let ‘x’ be the the number of Old visitors. Then, the number of middle-aged visitors = 2x.
Also, the number of Young visitors = 2*2x = 4x
$\Rightarrow$ x+2x+4x = 140
$\Rightarrow$ x = 20
It is given that total of 55 Economy tickets were sold out.
It is given that Young visitors half the total number of Platinum tickets that were sold.
Let ‘Y’ be the number of Platinum tickets bought by the Young visitors.
Then,the number of Platinum tickets sold = 2Y.
Consequently, we can say that the number of Gold tickets sold = 140 – 55 – 2Y = 85 – 2Y.
Let us assume that ‘Z’ is the number of Economy tickets bought by the Old visitors. It is given that the number of Gold tickets bought by Old visitors was equal to the number of Economy tickets bought by Old visitors.
Let us check with the help of options.
Option (A): The numbers of Gold and Platinum tickets bought by Young visitors were equal.
Y = 42 – Y
$\Rightarrow$ Y = 21. Hence, this statement can be true.
Option (B): The numbers of Middle-aged and Young visitors buying Gold tickets were equal
43 – (Y+Z) = 42 – Y
$\Rightarrow$ Z = 1. Hence, this statement can be true.
Option (C): The numbers of Old and Middle-aged visitors buying Platinum tickets were equal
20 – 2Z = (Y+2Z) – 20
$\Rightarrow$ Y+4Z = 40. Hence, this statement can be true.
Option (D): The numbers of Old and Middle-aged visitors buying Economy tickets were equal
Z = 17 – Z
$\Rightarrow$ Z = 8.5. This is not possible as Z has to be an integer. Hence, we can say that this statement is false.
Instructions
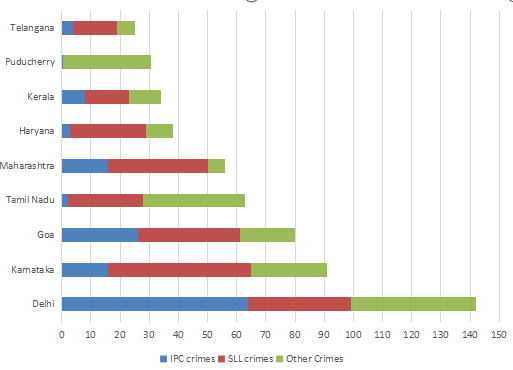
The Ministry of Home Affairs is analysing crimes committed by foreigners in different states and union territories (UT) of India. All cases refer to the ones registered against foreigners in 2016.
The number of cases – classified into three categories: IPC crimes, SLL crimes and other crimes – for nine states/UTs are shown in the figure below. These nine belong to the top ten states/UTs in terms of the total number of cases registered. The remaining state (among top ten) is West Bengal, where all the 520 cases registered were SLL crimes.
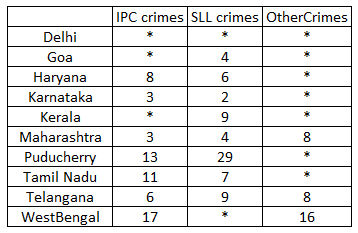
The table below shows the ranks of the ten states/UTs mentioned above among ALL states/UTs of India in terms of the number of cases registered in each of the three category of crimes. A state/UT is given rank r for a category of crimes if there are (r‐1) states/UTs having a larger number of cases registered in that category of crimes. For example, if two states have the same number of cases in a category, and exactly three other states/UTs have larger numbers of cases registered in the same category, then both the states are given rank 4 in that category. Missing ranks in the table are denoted by *.
Question 13: What is the rank of Kerala in the ‘IPC crimes’ category?
13) Answer: 5
Solution:
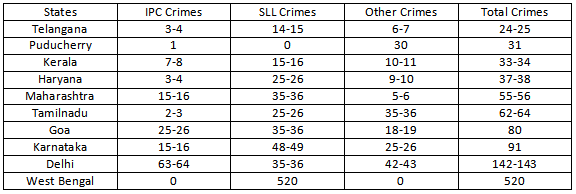
The data can be tabulated as follows(approximately):
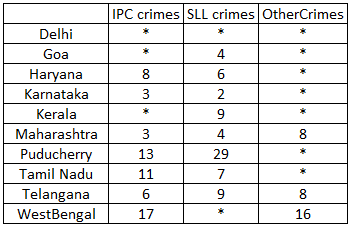
Rank of Delhi in IPC crimes category = 1, The rank of Karnataka and Maharashtra is 3(from table), then the rank of Goa can only be 2.
The rank of Telangana is 6 which has less |IPC crimes than Kerala, which means the rank of Kerala can be less than or equal to 5.
Now, there are two states with 3 ranks, so there will be no rank 4, there can only be rank 5 which is Kerala.
Checkout: CAT Free Practice Questions and Videos
Question 14: In the two states where the highest total number of cases are registered, the ratio of the total number of cases in IPC crimes to the total number in SLL crimes is closest to
a) 3 : 2
b) 19 : 20
c) 11 : 10
d) 1 : 9
14) Answer (D)
Solution:
The data can be tabulated as follows(approximately):
The highest cases are registered in West Bengal and Delhi.
The total number of IPC crimes = 63-64
The total number of SLL crimes = 520+35-36 = 555-556
Hence the ratio = (63-64)/(555-556) = 0.11 (Approximately) = 1:9
Question 15: Which of the following is DEFINITELY true about the ranks of states/UT in the ‘other crimes’ category?
i) Tamil Nadu: 2
ii) Puducherry: 3
a) both i) and ii)
b) only ii)
c) neither i) , nor ii)
d) only i)
15) Answer (A)
Solution:
The data can be tabulated as follows(approximately):
From the table, the rank of Tamilnadu in other crimes is 2. The states which are not in the table will have crimes less than Telangana(i.e 24-25)
From the table the rank of Pudducherry in other crimes is 3.
Question 16: What is the sum of the ranks of Delhi in the three categories of crimes?
16) Answer: 5
Solution:
The data can be tabulated as follows(approximately):
The data can be tabulated as follows(approximately):
The rank of Delhi in IPC crimes should be 1 because the states which are not in table cannot crime more than that of Telangana which is 24-25.
Similarly Delhi Rank in Other crimes will be 1.
Now in SLL crimes clearly West Bengal has rank 1. It is given that Karnataka has rank 2. The rank 3 can go to either Goa, Delhi and Maharashtra but Goa and Maharashtra already have rank 4. So Delhi will have rank 3. Also no state outside of the table can be ranked 3 in SLL crimes as maximum number of crime should be less than that of Telangana(24-25). Here the number of SLL crimes is 35-36.
Hence the sum of the ranks = 1+3+1=5


