
Data Interpretation Questions for SSC CGL PDF:
Download Interpretation Questions and Answers for SSC CGL Exam
Number System Questions for SSC CGL PDF
100 SSC CGL (latest pattern mocks) – Rs. 399
Download All SSC CGL Questions & Tricks PDF
Instructions (1-4): Study the Bar diagram carefully and answer the questions. The Bar diagram shows the trends of foreign direct investment (FDI) into India from all over the World (in Rs. crores).
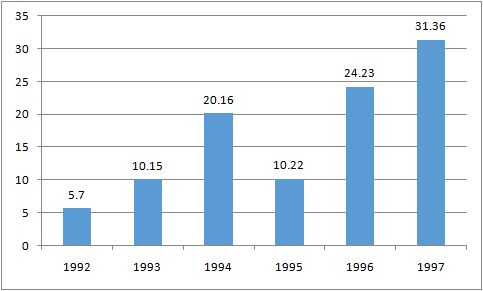
Question 1: The sum of FDI of 1992 and 1993 is
a) 15.58 cr
b) 15.85 cr
c) 15.22 cr
d) 15.65 cr
Question 2: The year which exhibited the 2nd highest growth percentage in FDI in India over the period shown is
a) 1993
b) 1994
c) 1997
d) 1996
Question 3: The ratio of investment in 1997 to the average investment is
a) 2:1
b) 1:2
c) 1:1
d) 3:1
Question 4: The absolute difference in FDI to India between 1996 and 1997
a) 7.29
b) 7.13
c) 7.16
d) 7.22
Instructions (5-8): Study the following graph carefully and answer the questions:

Question 5: Which state has the maximum percentage of electrified villages? (The graph shows the percent of villages which are not electrified).
a) B
b) C
c) D
d) F
Question 6: If the Central Government desires to give aid for speedy electrification starting from states with least electrification, which state will get fourth rank in order of priority? (The graph shows the percent of villages which are not electrified).
a) F
b) C
c) E
d) B
Question 7: How many States have at least 60% or more electrified villages? (The graph shows the percent of villages which are not electrified).
a) Five
b) Three
c) Four
d) Two
Question 8: Which state has twice the percentage of villages electrified in comparison to state D? (The graph shows the percent of villages which are not electrified).
a) A
b) E
c) F
d) C
Top Rated APP for SSC CGL Preparation
Answers & Solutions for Data Interpretation Questions for SSC CGL:
1) Answer (B)
FDI in 1992 (in Rs. crores) = 5.7
FDI in 1993 (in Rs. crores) = 10.15
=> The sum of FDI of 1992 and 1993 = 5.7 + 10.15
= 15.85
=> Ans – (B)
2) Answer (D)
Clearly, the highest growth percentage in FDI in India over the period shown is in 1997 = 31.36
Ans the 2nd highest growth percentage in FDI in India is in 1996 = 24.23
=> Ans – (D)
3) Answer (A)
Investment in 1997 (in Rs. crores) = 31.36 ≈ 32
Total investment of 6 years
= 5.7 + 10.15 + 20.16 + 10.22 + 24.23 + 31.36 = 101.82
=> Average investment = 101.82 / 6 = 16.97 ≈ 16
∴ Required ratio = 32 / 16 = 2 / 1
The ratio of investment in 1997 to the average investment = 2 : 1
=> Ans – (A)
4) Answer (B)
FDI in 1997 (in Rs. crores) = 31.36
FDI in 1996 (in Rs. crores) = 24.23
=> Absolute difference in FDI to India between 1996 and 1997 = 31.36 – 24.23
= 7.13
=> Ans – (B)
Answers & Solutions (5-8):
From the graph,

5) Answer (B)
We can clearly observe that State C has least percentage of villages which are not electrified.
Hence, State C has the maximum percentage of electrified villages.
=> Ans – (B)
6) Answer (A)
State with least electrification = Maximum percentage villages which are not electrified.
We can clearly determine the states in order of priority of least electrification = D, E, B, F, A, C.
∴ The state F will get fourth rank in order of priority.
=> Ans – (A)
7) Answer (B)
∴ We can clearly observe that three states (A,C and F) have at least 60% or more electrified villages.
=> Ans – (B)
8) Answer (D)
∴ We can clearly observe that state C has twice the percentage of villages electrified in
comparison to state D.
=> Ans – (D)


