
Data Interpretation Questions for SBI PO PDF:
Data Interpretation Questions for SBI PO PDF
20 SBI PO Prelims (latest pattern mocks) – Rs. 125
You can practice Banking Previous year solved papers
Download SBI PO 2018 Syllabus PDF
Instructions (1 – 5) : Number (n) of candidates (in lakhs) appearing for an entrance examination from six different states and the percentage (p) of candidates clearing the same over the years.
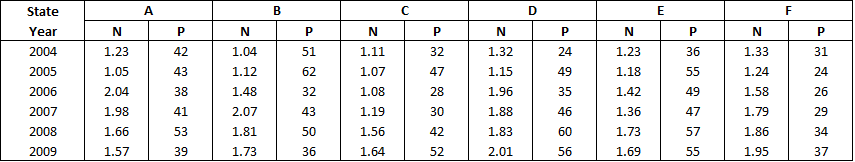
Question 1: What is the respective ratio of total number of candidates clearing the entrance exam from State B in the year 2004 to those clearing the entrance exam from State C in the same year
a) 221: 148
b) 218: 143
c) 148: 221
d) 143: 218
e) None of these
Question 2: In which year did the highest number of candidates clear the entrance exam fro State D ?
a) 2008
b) 2006
c) 2009
d) 2007
e) None of these
Question 3: What is the number of candidates not clearing the entrance exam from State A in the year 2007?
a) 186820
b) 11682
c) 1868200
d) 116820
e) None of these
Question 4: What is the total number of candidates clearing the entrance exam from States E and F together in the year 2006 ?
a) 16160
b) 110660
c) 1.1066
d) 1106600
e) None of these
Question 5: What is the average number of candidates appearing for the entrance exam from State D in the years 2007, 2008 and 2009 together ?
a) 190766.66
b) 180666.66
c) 180666.33
d) 190666.66
e) None of these
Take a Free Mock test for SBI PO
Instructions (6 – 10): The graph below gives the percentage rise in profits of two companies over the years. Study the graph carefully to answer the questions that follow.
Question 6: If the profit earned by Company L in the year 2005 was Rs. 1.84 lakhs, what was the profit earned by the company in the year 2006 ?
a) Rs. 2.12 lakhs
b) Rs. 2.3 lakhs
c) Rs. 2.04 lakhs
d) Cannot be determined
e) None of these
Question 7: If the profit earned by Company M in the year 2008 was Rs. 3.63 lakhs, what was he amount of profit earned by it in the year 2006 ?
a) Rs. 2.16 lakhs
b) Rs.1.98 lakhs
c) Rs. 2.42 lakhs
d) Cannot be determined
e) None of these
Question 8: What is the average percent rise in profit of Company L over all the years together?
a) 15.33
b) 25.33
c) 18.83
d) 25.83
e) None of these
Question 9: Which of the following statements is TRUE with respect to the above graph ?
a) Company M made the highest profit in the year 2009
b) Company L made least profit in the year 2005
c) The respective ratio between the profits earned by Company L and M In the year 2006 was 6:5
d) Company L made the highest profit in the year 2008
e) All are true
Question 10: What is the percentage increase in percent rise in profit of Company M in the year 2009 from the previous year ?
a) 25
b) 15
c) 50
d) 75
e) None of these
Banking 1 Year Plan – 350 Mocks for just Rs. 499
Daily Free GK – Current Affairs Tests
Answers & Solutions for Data Interpretation Questions for SBI PO PDF:
1) Answer (A)
The number of students from State B who cleared the exam in 2004 is 51%*1.04*100000 = 53040
The number of students from State C who cleared the exam in 2004 is 32%*1.11*100000 = 35520
Hence, the ratio is 221:148
2) Answer (C)
The number of students who cleared the exam in 2004 was 24%*1.32*100000 = 31680
The number of students who cleared the exam in 2005 was 49%*1.15*100000 = 56350
The number of students who cleared the exam in 2006 was 24%*1.32*100000 = 68600
The number of students who cleared the exam in 2007 was 46%*1.88*100000 = 86480
The number of students who cleared the exam in 2008 was 60%*1.83*100000 = 109800
The number of students who cleared the exam in 2009 was 56%*2.01*100000 = 112560
Hence, the year with the highest number of successful candidates from Section D is 2009.
3) Answer (D)
The percentage of students from State A who passed the exam in 2007 is 41%
So, the percentage of students from State A who failed the exam in 2007 is 59%
Hence, the number of students who failed the exam in 2007 is 59%*1.98*100000= 116820
4) Answer (B)
The number of students who passed the exam from State E in 2006 is 49%*1.42*100000 = 69,580
The number of students who passed the exam from State F in 2006 is 26%*1.58*100000 = 41,080
Hence, the total is 110,660
5) Answer (D)
The number of students who appeared for the exam from State D in 2007 is 1.88*100000 = 188000
The number of students who appeared for the exam from State D in 2008 is 1.83*100000 = 183000
The number of students who appeared for the exam from State D in 2009 is 2.01*100000 = 201000
Hence, the required average is 190,666.66
6) Answer (B)
Profit in 2006 = 1.84 * 125/100 = 1.84*5/4 = 0.46*5 = 2.3 lakh
7) Answer (C)
Let the profit in 2006 be x.
Profit in 2007 = 5x/4
Profit in 2008 = 6/5 * 5x/4 = 3x/2 = 3.63 lakh
=> x = 1.21*2 = 2.42 lakh
8) Answer (E)
The average percentage rise in profits over all the years for company L is average of the 6 years values ie. sum of each years value divided by 6 = 150/6 = 25%.
9) Answer (A)
The graphs show the percentage rise in profits. So, the profits for the two companies are
increasing from 2004 to 2009. So, the highest profit by both the companies is made in 2009 and the least profit in 2004.
Consider statement A: M made the highest profit in 2009. This statement is true.
Consider statement B: L made the least profit in 2005. This statement is false.
So, the answer is option (a) (Since option (e)) is not true anymore).
10) Answer (C)
Percent rise in profit of company M in 2008 = 20%
Percent rise in profit of company M in 2009 = 30%
Percentage increase = (30-20)/20 * 100 = 50%


