
Data Interpretation Questions for RRB Group-D
Download Top 15 RRB Group-D Data Interpretation Questions and Answers PDF. RRB Group-D Data Interpretation questions based on asked questions in previous exam papers very important for the Railway Group-D exam.
Download Data Interpretation Questions for RRB Group-D
Download RRB Group-D Previous Papers PDF
Take a RRB Group-D free mock test
Instructions
Given table shows marks of 6 students in 5 subjects and marks have been given in out of 600 marks. Study the table carefully and answer the following questions.
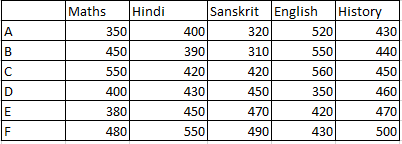
Question 1: Who got the lowest marks, taking all the subjects together?
a) E
b) A
c) F
d) B
Question 2: What is the percentage of marks obtained by C in Hindi out of the total marks obtained by him in all the subjects?
a) 8%
b) 9.4%
c) 17.5%
d) 11.2%
Question 3: What is the percentage of marks F got in Math out of total marks obtained by him?
a) 15.2%
b) 14.3%
c) 12.3%
d) 19.5%
Take a free mock test for RRB Group-D
770 Mocks (cracku Pass) Just Rs.199
Question 4: Who got the maximum total marks, taking all the subjects together?
a) C
b) F
c) E
d) A
Instructions
The following table shows the sectoral distribution of production of Fabrics in India
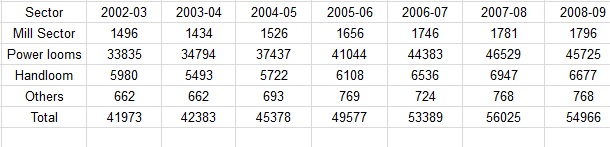
Question 5: If the same % decrease in the production of fabrics in 2008-09 continues the next year also what is the production in 2009-10 ?
a) 53972
b) 53927
c) 53792
d) 53279
Question 6: Read the statement below and answer the question that follow:
Statement I:The contribution of mill sector to the total production of Fabrics in India does not exceed 4%.
Statement II.The ratio of the production by mill sector to that of Handloom sector in 2004-05 and 2006-07 are almost same.
a) Only statement I is true
b) Only statement II is true
c) Both the statement I and II are true
d) Both the statement I and II are false
RRB Group D previous year papers
Question 7: What is the percentage increase (approximate) in the output by Mill sector in the year 2007-08 when compared to the previous year ?
a) 0.2
b) 3.0
c) 2.0
d) 2.4
Question 8: What is the share of output (approximate percentage) by the Handloom sector in the year 2005-06 ?
a) 12.6
b) 12.3
c) 12.2
d) 12.4
Instructions
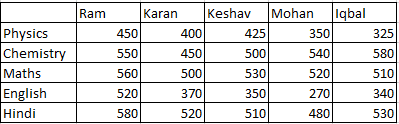
Following table shows the marks obtained by different students in different subjects out of 600. Study the following table and answer the following questions.
Question 9: Who got the maximum percentage of marks in Physics?
a) Iqbal
b) Ram
c) Keshav
d) Mohan
Question 10: Who got the maximum marks in all the subjects together?
a) Mohan
b) Ram
c) Iqbal
d) Keshav
RRB Group-D Important Questions (download PDF)
Question 11: What percentage more number of marks obtained by Iqbal as compared to Mohan in Hindi? (Round-off to nearest integer)
a) 10%
b) 5%
c) 9%
d) 14%
Question 12: What is the approximate percentage of marks Ram got in Hindi out of the total marks obtained by him in all the subjects?
a) 30%
b) 25%
c) 22%
d) 20%
Instructions
Given table shows the sectorial distribution of a product of a company in India. Study the table and answer the following questions.
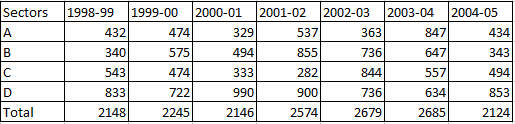
Question 13: If the same %decrement in the year 2004-05 continues for the next year also, what will be the production in 2005-06?
a) 1456
b) 1563
c) 1817
d) 1680
Question 14: Read the statements below and answer the questions that follows:
Statement 1: The Contribution of the B sector to the total production in Indian doesn’t exceed 25%.
Statement 2: The share of output of sector D in the year 2001-02 will be exceeding 33% of the total contribution in that year.
a) Only statement 1 is true
b) Only statement 2 is true
c) Both the statements are true
d) Both the statements are false
Question 15: What is the percentage increase (approximate) in the output of the sector D in the year 2004-05 when compared to previous year?
a) 25.5%
b) 30.5%
c) 31.5%
d) 34.5%
General Science Notes for RRB Exams (PDF)
Answers & Solutions:
1) Answer (B)
Total marks obtained by A = 2020
Total marks obtained by B = 2140
Total marks obtained by C = 2400
Total marks obtained by D = 2090
Total marks obtained by E = 2190
Total marks obtained by F = 2450
Hence, A got the lowest marks as 2020.
2) Answer (C)
Marks obtained by C in Hindi = 420
Total Marks obtained by C = 2400
Percentage of marks obtained by him = $\frac{420}{2400} \times 100$ = 17.5%
3) Answer (D)
Marks obtained by F in Math = 480
Total Marks obtained by F = 2450
Percentage of Marks obtained by him = $\frac{480}{2450} \times 100$ = 19.5%
4) Answer (B)
Total marks obtained by A = 2020
Total marks obtained by B = 2140
Total marks obtained by C = 2400
Total marks obtained by D = 2090
Total marks obtained by E = 2190
Total marks obtained by F = 2450
Hence, F got the max. Marks as 2450
5) Answer (B)
percentage loss in 2008-09=(56025-54966)/56025 ×100=1.89%
the percentage loss in 2009-10 is 1.89%
=> the fabric production in 2009-10=98.11% of 54966=53927.68≅= 53927
6) Answer (C)
percentage of mill sector to that of fabrics from 2002-03 to 2008-09 is given below:
3.56, 3.38 ,3.36, 3.32, 3.27, 3.17, 3.26
thus, in no year the % is greater than 4.∴ statement 1 is correct.
The ratio of mill sector to handloom in 2004-05 and 2005-06 are 26.67% and 27.1% respectively.∴ Statement 2 is also correct.Thus, option C is the right choice.
7) Answer (C)
approximate % increase in output of Mill sector in 2007-08 compared to previous year=$\frac{(1781-1746)}{1746}$×100%=2%
8) Answer (B)
The approximate percentage of Handloom in the total = 6108 / 49577 = 12.3%
9) Answer (B)
It is clear from the given table that Ram got the maximum marks in physics i.e. (450/600)*100 = 75%
10) Answer (B)
Ram’s total marks in all the subjects together = 2660
Karan’s total marks = 2240
Keshav’s total marks = 2315
Mohan’s total marks = 2160
Iqbal’s total marks = 2285
Hence, Ram got the max. Marks in all the subjects together.
11) Answer (A)
Marks of Iqbal in Hindi = 530
Marks of Mohan in Hindi = 480
Hence, percentage difference = $\frac{50}{480} \times 100 = 10% (Nearly)
12) Answer (C)
Total marks obtained by Ram in all the subjects = 2660
Marks obtained in hindi = 580
Percentage = 22%
13) Answer (D)
Decrement in the year 2004-05 = $\frac{2685-2124}{2685} \times 100 = 20.89 \%$
Hence, decrease for the next year = $2124 \times \frac{20.89}{100}$ = 443
New production for next year = 2124-443 = 1680
14) Answer (C)
For statement 1: Contribution of sector B = 3990 ; Total contribution = 16601
Hence, percentage contribution = $\frac{3990}{16601} \times 100= 24.03\%$
For statement 2: Contribution of sector D in the year 2001-02 = $\frac{900}{2574} \times 100 = 35\%$ (approx)
Hence, answer will be C
15) Answer (D)
Percentage increase will be equal to $\frac{853-634}{634} \times 100 = 34.5\%$
DOWNLOAD APP FOR RRB FREE MOCKS
We hope this Data Interpretation Questions for RRB Group-D Exam will be highly useful for your preparation.


