
Data Interpretation Questions for RRB Group D Set-4 PDF
Download Top-10 RRB Group-D Data Interpretation Questions Set-4 PDF. RRB Group – D Data Interpretation questions based on asked questions in previous exam papers very important for the Railway Group-D exam.
Download Data Interpretation Questions for RRB Group D Set-4 PDF
Download RRB Group-D Previous Papers PDF
Take a RRB Group-D free mock test
Instructions
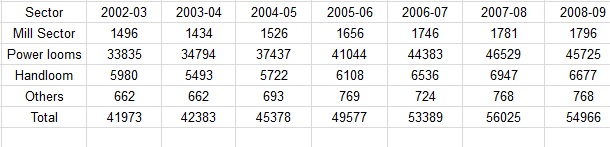
The following table shows the sectoral distribution of production of Fabrics in India
Question 1: Read the statement below and answer the question that follow:
Statement I:The contribution of mill sector to the total production of Fabrics in India does not exceed 4%.
Statement II.The ratio of the production by mill sector to that of Handloom sector in 2004-05 and 2006-07 are almost same.
a) Only statement I is true
b) Only statement II is true
c) Both the statement I and II are true
d) Both the statement I and II are false
Instructions
Study the following table and answer the questions based on it.
Below is the Household Expenditure (in Thousand rupees) per annum.
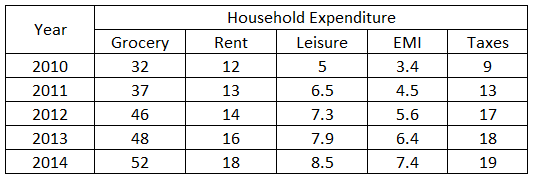
Question 2: What is the total Household Expenditure for the year 2012?
a) Rs. 89,900
b) Rs. 87,120
c) Rs. 89,100
d) Rs. 88,200
Instructions
Study the following table and answer the questions below
Given below is the list of Expenditures (in lakh Rupees) per annum of company Z Over the Years.
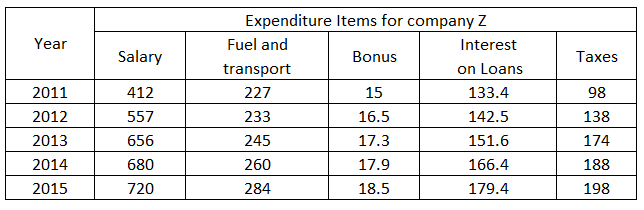
Question 3: What is the total expenditure of Company Z in the year 2011?
a) Rs. 897.2 Lakhs
b) Rs. 827.5 Lakhs
c) Rs. 885.4 Lakhs
d) Rs. 727.1 Lakhs
Instructions
Consider the table and answer questions based on it
The following table represents the category wise count of books in four local libraries.
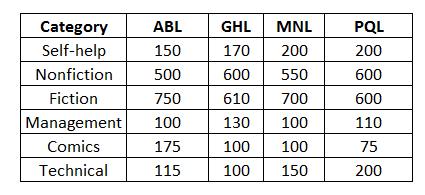
Question 4: The difference between the total number of nonfiction and management books of all four libraries is
a) 1850
b) 1810
c) 2250
d) 1800
Instructions
Read the table and answer the questions based on it.
The table below represents the distance (in km) travelled by six trucks on six different days of the week.
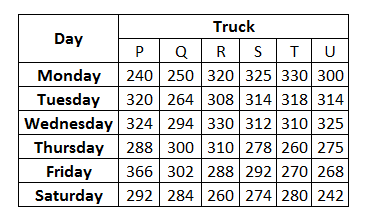
Question 5: What is the total distance travelled by all the trucks together on Saturday’?
a) 1623 km
b) 1263 km
c) 1362 km
d) 1632 km
Download RRB Group-D Previous Papers PDF
Take a RRB Group-D free mock test
Instructions
Consider the chart and answer questions based on it.
The following pie chart shows fruit tree distribution in a farm land.
Fruits

Question 6: What is the ratio of Chikoo and Mango trees to that of Jamun, Orange and Banana trees in the farm land?
a) 1
b) 1:3
c) 11:9
d) 3:1
Question 7: The runs scored by two batsmen over 7 matches are given below. Which batsman’s average was better?

a) Batsman 1 – 39.3
b) Batsman 1 – 45.9
c) Batsman 1 – 43.2
d) Batsman 2 – 45.9
Question 8: Based on the following graph. which retailer offers all the three products for less than ₹ 10 each?

Note: The X axis indicates price in rupees and Y axis represents the retailer
a) Retailer 4
b) Retailer 2
c) Retailer 3
d) Retailer 1
Question 9: The following bar graph shows information on the sales of the personal computers by the company “XYZ” for the last 10 years
lakhs units

How many units of personal computers were sold by the company XYZ in 2011?
a) 60
b) 50
c) 80
d) 70
Question 10: The following pie diagram shows information about tyres manufacturing data from various companies in India during 2017. If the total tyres produced in India dining 2017 was 1,80,000 units, how many units of tyres were produced by company ‘D’?

a) 18000
b) 36000
c) 9000
d) 27000
RRB Group D previous year papers
Answers & Solutions:
1) Answer (C)
percentage of mill sector to that of fabrics from 2002-03 to 2008-09 is given below:
3.56, 3.38 ,3.36, 3.32, 3.27, 3.17, 3.26
thus, in no year the % is greater than 4.∴ statement 1 is correct.
The ratio of mill sector to handloom in 2004-05 and 2005-06 are 26.67% and 27.1% respectively.∴ Statement 2 is also correct.Thus, option C is the right choice.
2) Answer (A)
Total household expenditure for year 2012
=(46 + 14 + 7.3 + 5.6 + 17) $\times 1000$
=89,900
So, the answer would be option a)Rs. 89,900
3) Answer (C)
In 2011 expenditure made by company Z in different sectors are :
Salary=412 lakhs.
Fuel and Transport=227 lakhs.
Bonus=15 lakhs.
Interest on loans=133.4 lakhs.
Tsxes=98 lakhs.
So, in 2011,total expenditure made by company Z was$=412+227+15+133.4+98$lakhs
$=885.4$lskhs.
C is correct choice.
4) Answer (B)
Nonfiction = (500+600+550+600)= 2250
Management = (100+130+100+ 110) = 440
difference = 1810
5) Answer (D)
total distance travelled on sunday=292+284+260+274+280+242=1632km
6) Answer (C)
Required ratio = (20 + 35) : (10 + 15 + 20) = 55 : 45 = 11 : 9.
7) Answer (D)
Batsman 1 total runs in 7 matches = 42+51+9+78+63+20+12 = 275
Average of batsman 1 = $\frac{275}{7}=39.30$
Batsman 2 total runs in 7 matches = 30+22+91+76+84+11+7 = 321
Average of batsman 2 = $\frac{321}{7}=45.90$
8) Answer (D)
According to the question, in given venn diagram-
we can see that Retailer 1’s products are less than 10 Rs.
Hence option ‘D’ is correct.
9) Answer (A)
from bar graph ,in 2011 y axis clearly represents 60,
Hence option ‘A’ is correct.
10) Answer (D)
According to the question, on drawing Venn diagram-
1,80,000$\times\ \ \ \frac{\ 15}{100}$ =27000


