
Data Interpretation Questions for RRB Group-D Set-2 PDF
Download Top-15 RRB Group-D Data Interpretation Questions Set-2 PDF. RRB GROUP-D Data Interpretation questions based on asked questions in previous exam papers very important for the Railway Group-D exam.
Download Data Interpretation Questions for RRB Group-D Set-2 PDF
Download RRB Group-D Previous Papers PDF
Take a RRB Group-D free mock test
Instructions
Given table shows the sectorial distribution of a product of a company in India. Study the table and answer the following questions.
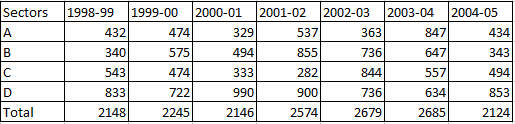
Question 1: What is the share (Approximate percentage) of sector C in the year 2002-03?
a) 30.5%
b) 34%
c) 32%
d) 31.5%
InstructionsDirections :The pie chart, given here, represents the number of valid votes obtained by four students who contested election for school leadership. The total number of valid votes polled was 720. Observe the chart and answer the questions based on it.
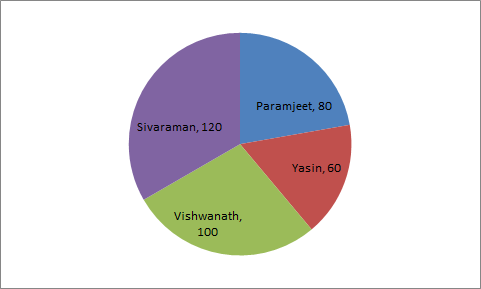
Number represented in pie-chart are in degrees.
Question 2: What was the winner ?
a) Sivaraman
b) Paramjeet
c) Yasin
d) Vishwanath
InstructionsDirections : The following graph shows the production of cotton bales of 100 kg each in lakhs by different states A, B, C, D and E over the years. Study the graph and answer the following Questions.
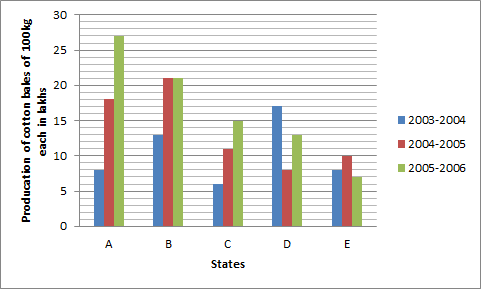
Question 3: In which State(s) is there a steady increase in the production of cotton during the given period?
a) A and B
b) B and D
c) A and C
d) D and E
Take a free mock test for RRB Group-D
770 Mocks (cracku Pass) Just Rs.199
Question 4: How many kg of cotton was produced by State C during the given period?
a) 32,00,00,000 kg
b) 42,50,00,000 kg
c) 33,00,00,000 kg
d) 35,00,00,000 kg
Question 5: The number of States for which the production of cotton in 2005-2006 is less than or equal to the preceding year is
a) 3
b) 2
c) 1
d) There is no such States
Instructions
Directions : Population of the five adjacent areas of a town, in the year of 2020, are represented in the following Pie-chart. The ratio of the numbers of males to that of females in these areas are states in the table below. The total of the population in all the five areas is 72 lakh. Study the Pie-chart and the table and then answer the questions.
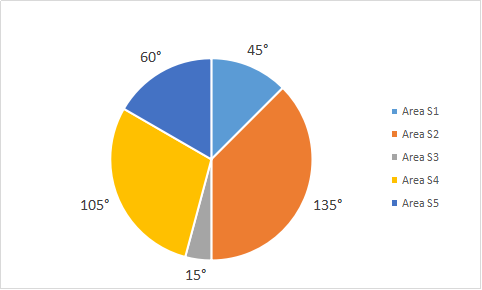
Ratio of number of males(M) to females(F)

Question 6: 12 lakh in the population of the area
a) S1
b) S3
c) S5
d) S4
RRB Group D previous year papers
Question 7: The number of males in the areas S1 and S4 together is
a) 13.8 lakh
b) 8.2 lakh
c) 16.2 lakh
d) 15.8 lakh
Instructions
Study the following Histogram and answer the following questions.
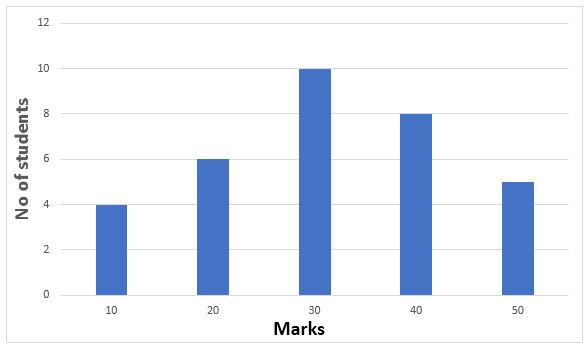
Question 8: The total number of students involved in the data is
a) 33
b) 32
c) 43
d) 42
Question 9: The maximum number of students got the marks in the interval of
a) 10-20
b) 20-30
c) 30-40
d) 40-50
Question 10: The least number of students got the marks in the interval
a) 40-50
b) 20-30
c) 10-20
d) 0-10
RRB Group-D Important Questions (download PDF)
Question 11: Cost estimated by a family in renovation of its house Total cost estimate Rs. 2,40,000

During the process of renovation the family actually incurs miscellaneous expenditure of Rs. 20,400. The miscellaneous expenditure incurred by the family is what percent of the total estimated cost?
a) 9.5
b) 9
c) 8.5
d) 10.5
e) None of the above
Question 12:

In a certain country, allocations to various sectors of the yearly budget per Rs.1000 crores are represented by this pie-diagram. The expenditure (in Rs.) on Agriculture is
a) 250 crores
b) 150 crores
c) 300 crores
d) 200 crores
Instructions
Study the following information carefully and answer the questions that follow.
The following graph shows the total number of medals won by Australia, China, and USA in Olympic Games over the years.

It is given that in each year, all the three countries won an even number of medals.
Question 13: Which country won the highest number of medals over the years?
a) Australia
b) China
c) USA
d) More than one of the above
Question 14: What is the difference between the total number of medals won by these countries in 2008 and 2012?
a) 22
b) 20
c) 18
d) None of these
Question 15: Which country saw the highest percentage increase in the number of medals from 2000 to 2016?
a) Australia
b) China
c) USA
d) More than one of the above
General Science Notes for RRB Exams (PDF)
Answers & Solutions:
1) Answer (D)
Share of sector C will be = $\frac{844}{2679} \times 100$ = 31.5%
2) Answer (A)
Person having maximum no. of distribution will have max. no. of votes
3) Answer (C)
Only in A and C there is a steady increment in production of cotton as in D and E , It is decresed and in B production is equal for two years. Hence answer will be C).
4) Answer (A)
Production of C in year 2003-2004 = 6 per 100 kg in lakh
in year 2004-05 = 11 per 100 kg in lakh
in year 2005-06 = 15 per 100 kg in lakh
Total will be 32 per 100 kg in lakh or 320000000 kg
5) Answer (B)
In B, production is same as its previous year whether in C , it is decreased.
6) Answer (C)
7) Answer (A)
8) Answer (A)
Total no. of students involved in the data is 4 +6 +10+ 8+ 5 = 33.
9) Answer (B)
Clearly, the maximum no. of 10 students got in the interval of 20-30 marks
10) Answer (D)
Clearly, least no. of 4 students. is for the 0-10 marks .
11) Answer (C)
12) Answer (D)
13) Answer (C)
The data given in the graph can be tabulated as follows:

From the above table, we can see that USA won the most number of medals in these years i.e. 346.
14) Answer (A)
The data given in the graph can be tabulated as follows:
From the above table we can see that the total number of medals won in 2012 is 202 while that in 2008 is 180. Thus, the difference is 22.
Option A is the correct answer.
15) Answer (B)
The data given in the graph can be tabulated as follows:
From the table we can see that the percent increase for each country is
Australia- $\frac{72-58}{58} \times 100 \approx 24$%
China- $\frac{68-42}{42} \times 100 \approx 62$%
USA- $\frac{84-68}{68} \times 100 \approx 23.5$%
We can see that China has the highest percent increase in the number of medals won. So, B is the correct answer.
DOWNLOAD APP FOR RRB FREE MOCKS
We hope this Data Interpretation Questions Set 2 PDF for RRB Group-D Exam will be highly useful for your preparation


