
Data Interpretation Questions for IBPS CLERK PDF
Download Data Interpretation Questions For IBPS Clerk PDF Set – 2. Practice Data Interpretation Questions and Answers for Banking Exams based on asked questions in previous papers.
Download Data Interpretation Questions for IBPS CLERK PDF
105 IBPS Clerk for just Rs. 199
Take Free IBPS Clerk Mock Test
Download IBPS Clerk Previous papers PDF
Go to Free Banking Study Material (15,000 Solved Questions)
Instructions
A school consisting of a total of 1560 students has boys and girls in the ratio of 7:5 respectively. All the students are enrolled in different types of hobby classes, viz: Singing, Dancing and Painting.
One-fifth of the boys are enrolled in only Dancing classes.
Twenty percent of the girls are enrolled in only Painting classes.
Ten percent of the boys are enrolled in only Singing classes.
Twenty four percent of the girls are enrolled in both Singing and Dancing classes together.
The number of girls enrolled in only Singing classes is two hundred percent of the boys enrolled in the same.
One-thirteenth of the boys are enrolled in all the three classes together.
The respective ratio of boys enrolled in Dancing and Painting classes together to the girls enrolled in the same is 2 :1 respectively.
Ten percent of the girls are enrolled in only Dancing classes whereas eight percent of the girls are enrolled in both Dancing and Painting classes together.
The remaining girls are enrolled in all the three classes together.
The number of boys enrolled in Singing and Dancing classes together is fifty percent of the number of girls enrolled in the same.
The remaining boys are enrolled in only Painting classes.
Question 1: Total number of girls enrolled in Singing is approximately what percent of the total number of students in the school ?
a) 37
b) 19
c) 32
d) 14
e) 26
Question 2: What is the total number of boys who are enrolled in Dancing ?
a) 318
b) 364
c) 292
d) 434
e) None of these
Instructions
Direction: The graph below gives the percentage rise in profits of two companies over the years. Study the graph carefully to answer the questions that follow.
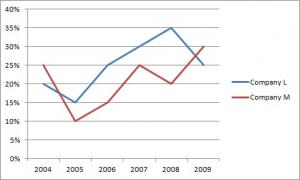
Question 3: What is the percentage increase in percent rise in profit of Company M in the year 2009 from the previour year ?
a) 25
b) 15
c) 50
d) 75
e) None of these
Question 4: Which of the following statements is TRUE with respect to the above graph ?
a) Company M made the highest profit in the year 2009
b) Company L made least profit in the year 2005
c) The respective ratio between the profits earned by Company L and M In the year 2006 was 6:5
d) Company L made the highest profit in the year 2008
e) All are true
Question 5: What is the average percent rise in profit of Company L over all the years together?
a) 15.33
b) 25.33
c) 18.83
d) 25.83
e) None of these
Question 6: If the profit earned by Company M in the year 2008 was Rs. 3.63 lakhs, what was he amount of profit earned by it in the year 2006 ?
a) Rs. 2.16 lakhs
b) Rs.1.98 lakhs
c) Rs. 2.42 lakhs
d) Cannot be determined
e) None of these
General Knowledge Questions & Answers PDF
Question 7: If the profit earned by Company L in the year 2005 was Rs. 1.84 lakhs, what was the profit earned by the company in the year 2006 ?
a) Rs. 2.12 lakhs
b) Rs. 2.3 lakhs
c) Rs. 2.04 lakhs
d) Cannot be determined
e) None of these
Instructions
Direction: Study the given pie-charts carefully to answer the questions that follow.
Given below are three charts showing break ups of
a) Number of employees working in different departments of an organization
b) Number of males in the organization and
c) Number of employees who recently got promoted in each department
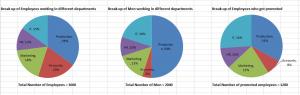
Question 8: The number of employees who got promoted from the HR department was what percent of the total number of employees working in that department ? (rounded off to two digits after decimal)
a) 36.18
b) 30.56
c) 47.22
d) 28.16
e) None of these
Question 9: The total number of employees who got promoted from all the departments together was what percent of the total number of employees working in all the departments together? (Rounded off to the nearest integer)
a) 56
b) 21
c) 45
d) 33
e) 51
IBPS Clerk Free Mock Test 2018 (Hindi/English)
Question 10: How many females work in the Accounts department?
a) 618
b) 592
c) 566
d) 624
e) None of these
Question 11: What is the total number of females working in the Production and Marketing departments together?
a) 468
b) 812
c) 582
d) 972
e) None of these
Question 12: If half of the number of employees who got promoted from the IT department were males, what was the approximate percentage of males who got promoted from the IT department ?
a) 61
b) 29
c) 54
d) 42
e) 38
Instructions
Number (n) of candidates (in lakhs) appearing for an entrance examination from six different states and the percentage (p) of candidates clearing the same over the years
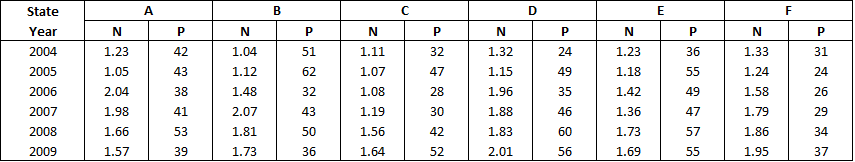
Question 13: What is the average number of candidates appearing for the entrance exam from State D in the years 2007, 2008 and 2009 together ?
a) 190766.66
b) 180666.66
c) 180666.33
d) 190666.66
e) None of these
Question 14: What is the total numberof candidates clearing the entrance exam from States E and F together in the year 2006 ?
a) 16160
b) 110660
c) 1.1066
d) 1106600
e) None of these
Question 15: What is the number of candidates not clearing the entrance exam from State A in the year 2007?
a) 186820
b) 11682
c) 1868200
d) 116820
e) None of these
Question 16: In which year did the highest number of candidates clear the entrance exam from State D ?
a) 2008
b) 2006
c) 2009
d) 2007
e) None of these
Question 17: What is the respective ratio of total number of candidates clearing the entrance exam from State B in the year 2004 to those clearing the entrance exam from State C in the same year
a) 221: 148
b) 218: 143
c) 148: 221
d) 143: 218
e) None of these
Highly Rated IBPS Clerk Preparation App
Answers & Solutions:
1) Answer (E)
Boys : Girls = 7 : 5
No. of boys = 7/12 * 1560 = 910
No. of girls = 650
No. of boys enrolled in only Dancing = 910/5 = 182
No. of girls in only Painting = 650/5 = 130
No. of boys in only singing = 91
No. of girls in both singing and dancing = 24/100 * 650 = 156
No. of girls in only Singing = 91*2 = 182
No. of boys in all three = 1/13 * 910 = 70
No. of girls in both dancing and painting = 8/100 * 650 = 52
No. of girls in only dancing = 650/10 = 65
So, no. of boys in both dancing and painting = 2*52 = 104
No. of girls in all three = 65


No. of boys in both singing and dancing = 156/2 = 78
No. of boys in only painting = 385
Total number of girls in Singing = 403
Required ratio = 403/1560 = 26% approximately
2) Answer (D)
Boys : Girls = 7 : 5
No. of boys = 7/12 * 1560 = 910
No. of girls = 650
No. of boys enrolled in only Dancing = 910/5 = 182
No. of girls in only Painting = 650/5 = 130
No. of boys in only singing = 91
No. of girls in both singing and dancing = 24/100 * 650 = 156
No. of girls in only Singing = 91*2 = 182
No. of boys in all three = 1/13 * 910 = 70
No. of girls in both dancing and painting = 8/100 * 650 = 52
No. of girls in only dancing = 650/10 = 65
So, no. of boys in both dancing and painting = 2*52 = 104
No. of girls in all three = 65
No. of boys in both singing and dancing = 156/2 = 78
No. of boys in only painting = 385
Total number of boys enrolled in Dancing = 434
3) Answer (C)
Percent rise in profit of company M in 2008 = 20%
Percent rise in profit of company M in 2009 = 30%
Percentage increase = (30-20)/20 * 100 = 50%
4) Answer (A)
The graphs show the percentage rise in profits. So, the profits for the two companies are increasing from 2004 to 2009. So, the highest profit by both the companies is made in 2009 and the least profit in 2004.
Consider statement A: M made the highest profit in 2009. This statement is true.
Consider statement B: L made the least profit in 2005. This statement is false.
So, the answer is option a) (Since option e) is not true anymore).
5) Answer (E)
The average percentage rise in profits over all the years for company L is average of the 6 years values ie. sum of each years value divided by 6 = 150/6 = 25%.
6) Answer (C)
Let the profit in 2006 be x.
Profit in 2007 = 5x/4
Profit in 2008 = 6/5 * 5x/4 = 3x/2 = 3.63 lakh
=> x = 1.21*2 = 2.42 lakh
7) Answer (B)
Profit in 2006 = 1.84 * 125/100 = 1.84*5/4 = 0.46*5 = 2.3 lakh
8) Answer (B)
The number of employees promoted in HR = 11% of 1200 = 132
Total number of employees in HR = 12% of 3600 = 432
=> percentage of employees promoted in HR = $\frac{132}{432}*100$ = 30.56%
9) Answer (D)
Total number of employees promoted = 1200
Total number of employees working = 3600
Percentage of employees promoted = $\frac{1200}{3600}*100$ = 33 (approx)
10) Answer (A)
Number of employees in accounts department = 20% of 3600 = 720
Number of male employees in accounts department = 5% of 2040 = 102
Number of female employees in accounts department = 720 – 102 = 618
11) Answer (C)
Total number of employees in production and marketing = 53% of 3600 = 1908
Total number of male employees in production and marketing = 65% of 2040 = 1326
Total number of female employees in production and marketing = 1908 – 1326 =582
12) Answer (E)
Number of IT employees = 20% of 2040 = 408
Number of IT employees promoted = 26% of 1200 = 312
Half of these are males => number of male IT employees promoted = 156
=> Percentage of male IT employees promoted = $\frac{156}{408}*100$ = 38%
13) Answer (D)
The number of students who appeared for the exam from State D in 2007 is 1.88*100000 = 188000
The number of students who appeared for the exam from State D in 2008 is 1.83*100000 = 183000
The number of students who appeared for the exam from State D in 2009 is 2.01*100000 = 201000
Hence, the required average is 190,666.66
14) Answer (B)
The number of students who passed the exam from State E in 2006 is 49%*1.42*100000 = 69,580
The number of students who passed the exam from State F in 2006 is 26%*1.58*100000 = 41,080
Hence, the total is 110,660
15) Answer (D)
The percentage of students from State A who passed the exam in 2007 is 41%
So, the percentage of students from State A who failed the exam in 2007 is 59%
Hence, the number of students who failed the exam in 2007 is 59%*1.98*100000= 116820
16) Answer (C)
The number of students who cleared the exam in 2004 was 24%*1.32*100000 = 31680
The number of students who cleared the exam in 2005 was 49%*1.15*100000 = 56350
The number of students who cleared the exam in 2006 was 24%*1.32*100000 = 68600
The number of students who cleared the exam in 2007 was 46%*1.88*100000 = 86480
The number of students who cleared the exam in 2008 was 60%*1.83*100000 = 109800
The number of students who cleared the exam in 2009 was 56%*2.01*100000 = 112560
Hence, the year with the highest number of successful candidates from Section D is 2009
17) Answer (A)
The number of students from State B who cleared the exam in 2004 is 51%*1.04*100000 = 53040
The number of students from State C who cleared the exam in 2004 is 32%*1.11*100000 = 35520
Hence, the ratio is 221:148


