
Data Analysis and Interpretation Questions for SBI PO PDF:
Data Analysis & Interpretation is a separate section in the mains exam of SBI PO. There will be 35 questions carrying a total of 60 marks and 45 minutes is allotted to this section. So, proper preparation is very much needed for this section to clear cutoffs in mains exam. We have provided some important data interpretation questions along with solutions for Bank PO exams.
Data Analysis and Interpretation Questions for SBI PO PDF
75 SBI Po Mocks Offer (latest pattern mocks) – Rs. 199
[icegram campaigns=”7908″]
You can practice Banking Previous year solved papers
Download SBI PO 2018 Syllabus PDF
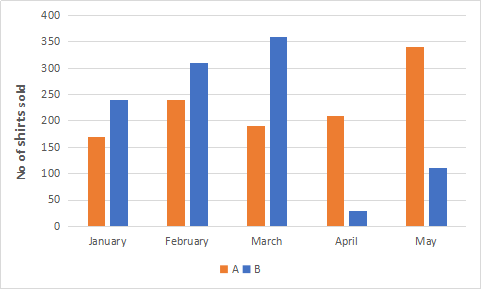
Directions (1 – 5): Refer to the graph and answer the given questions.Data related to number of shirts sold by two stores (A and B) during 5 months:
Question 1: What is the respective ratio between total number of shirts sold by store B in January and February together and that by the same store in April and May together?
a) 10 : 9
b) 7 : 5
c) 5 : 3
d) 3 : 2
e) None of these
Question 2: What is the average number of shirts sold by store A in January, April and May?
a) 270
b) 220
c) 260
d) 240
e) 230
Question 3: The number of shirts sold by store A increased by what percent from February to May?
a) $39\frac{1}{3}$
b) $41\frac{2}{3}$
c) $47\frac{2}{3}$
d) $43\frac{1}{3}$
e) $45\frac{2}{3}$
Question 4: If the total number of shirts sold by store A and B together in June is 20% more than that sold in March, what was the total number of shirts sold by stores A and B together in June?
a) 680
b) 690
c) 650
d) 670
e) 660
Question 5: If the total number of shirts sold by stores A and B together in December is 25% less than that sold in April, what was the total number of shirts sold by stores A and B together in December?
a) 415
b) 400
c) 180
d) 395
e) 425
Take a Free Mock test for SBI PO
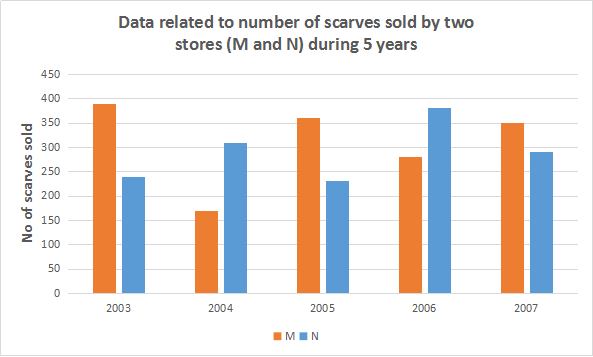
Directions (6 – 10): Refer to the graph and answer the given questions.
Question 6: If the respective ratio between total number of scarves sold by stores M and N together in 2003 and that in 2008 is 7: 11, what is the total number of scarves sold by stores M and N together in 2008?
a) 880
b) 1100
c) 660
d) 770
e) 990
Question 7: If the total number of scarves sold by stores M and N together in 2010 is 105% of that in 2004, what is the total number of scarves sold by stores M and N together in 2010?
a) 508
b) 524
c) 520
d) 504
e) 512
Question 8: The number of scarves sold by store M decreased by what percent from 2005 to 2006?
a) $18\frac{1}{3}$
b) $22\frac{2}{9}$
c) $32\frac{4}{9}$
d) $24\frac{1}{3}$
e) $20\frac{2}{3}$
Question 9: What is the difference between total number of scarves sold by store M in 2003 and 2004 together and total number of scarves sold by store N in 2006 and 2007 together?
a) 150
b) 130
c) 90
d) 100
e) 110
Question 10: What is the average number of scarves sold by store N in 2005,2006 and 2007?
a) 310
b) 280
c) 220
d) 290
e) 300
Banking 1 Year Plan – 350 Mocks for just Rs. 499
Daily Free GK – Current Affairs Tests
Answers & Solutions for Data Analysis and Interpretation Questions for SBI PO PDF:
1) Answer (E)
Total number of shirts sold by store B in January and February
= 240 + 310 = 550
Total number of shirts sold by store B in April and May
= 30 + 110 = 140
=> Required ratio = $\frac{550}{140}$
= $55 : 14$
2) Answer (D)
Number of shirts sold by store A in January, April and May
= 170 + 210 + 340 = 720
=> Required average = $\frac{720}{3}$
= $240$
3) Answer (B)
Number of shirts sold by store A in February = 240
Number of shirts sold by store A in May = 340
=> Required % increase = $\frac{340 – 240}{240} \times 100$
= $\frac{125}{3} = 41 \frac{2}{3} \%$
4) Answer (E)
Total number of shirts sold by store A and B together in March
= 190 + 360 = 550
=> Total number of shirts sold by store A and B together in June
= $550 + \frac{20}{100} \times 550$
= $550 + 110 = 660$
5) Answer (C)
Total number of shirts sold by stores A and B together in April
= 210 + 30 = 240
=> Total number of shirts sold by stores A and B together in December
= $240 – \frac{25}{100} \times 240$
= $240 – 60 = 180$
6) Answer (E)
Total number of scarves sold by stores M and N together in 2003
= 390 + 240 = 630
Also, ratio between total number of scarves sold by stores M and N together in 2003 and that in 2008 = 7: 11
=> Total number of scarves sold by stores M and N together in 2008
= $\frac{11}{7} \times 630$
= $11 \times 90 = 990$
7) Answer (D)
Total number of scarves sold by stores M and N together in 2004
= 170 + 310 = 480
Also, total number of scarves sold by stores M and N together in 2010 is 105% of that in 2004
=> Total number of scarves sold by stores M and N together in 2010
= $\frac{105}{100} \times 480$
= $504$
8) Answer (B)
Number of scarves sold by store M in 2005 = 360
Number of scarves sold by store M in 2006 = 28
=> Required % decrease = $\frac{360 – 280}{360} \times 100$
= $\frac{200}{9} = 22 \frac{2}{9} \%$
9) Answer (E)
Total number of scarves sold by store M in 2003 and 2004 together
= 390 + 170 = 560
Total number of scarves sold by store N in 2006 and 2007 together
= 380 + 290 = 670
=> Required difference = 670 – 560 = 110
10) Answer (E)
Number of scarves sold by store N in 2005, 2006 and 2007
= 230 + 380 + 290 = 900
=> Required average = $\frac{900}{3}$
= $300$


