Important CAT Data Interpretation Questions [Download PDF]
When it comes to the CAT LRDI Section, Data Interpretation is a crucial topic to master. For those unfamiliar with these types of questions, it’s recommended to review the Data Interpretation Questions from CAT previous years papers. This article provides valuable PDF resources for significant CAT Data Interpretation questions, complete with solutions and helpful tips for solving them. These downloadable CAT Data Interpretation questions also feature detailed solutions and essential tricks to enhance your understanding and proficiency in this area.
Download Data Interpretation Questions for CAT
Instructions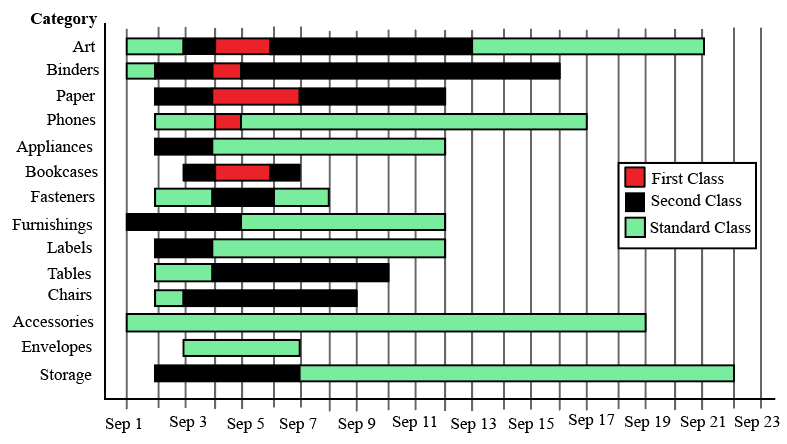
The different bars in the diagram above provide information about different orders in various categories (Art, Binders, ….) that were booked in the first two weeks of September of a store for one client. The colour and pattern of a bar denotes the ship mode (First Class / Second Class / Standard Class). The left end point of a bar indicates the booking day of the order, while the right end point indicates the dispatch day of the order. The difference between the dispatch day and the booking day (measured in terms of the number of days) is called the processing time of the order. For the same category, an order is considered for booking only after the previous order of the same category is dispatched. No two consecutive orders of the same category had identical ship mode during this period.
For example, there were only two orders in the furnishing category during this period. The first one was shipped in the Second Class. It was booked on Sep 1 and dispatched on Sep 5. The second order was shipped in the Standard class. It was booked on Sep 5 (although the order might have been placed before that) and dispatched on Sep 12. So the processing times were 4 and 7 days respectively for these orders.
Question 1: How many days between Sep 1 and Sep 14 (both inclusive) had no booking from this client considering all the above categories?
1) Answer: 6
Solution:
Accumulating all the data :
We get the following table :
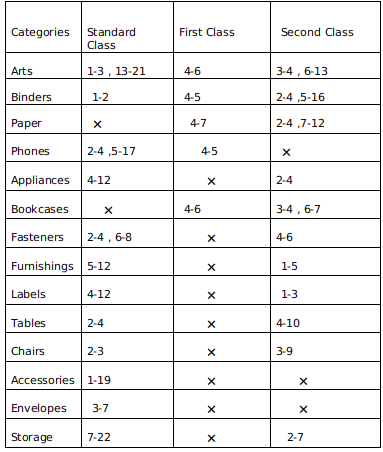
Note a-b : represents the duration where a is the day when order is booked and b is the day when it is dispatched .
Now No booking days from the table are : September 8,9,10,11,12 and 14.
So a total of 6 days .
Question 2: What was the average processing time of all orders in the categories which had only one type of ship mode?
2) Answer: 11
Solution:
Accumulating all the data :
We get the following table :

Note a-b : represents the duration where a is the day when order is booked and b is the day when it is dispatched .
Now Envelopes and Accessories has only 1 ship mode i.e Standard class .
So therefore processing days for envelopes = 7-3 =4
and processing days for accessories = 19-1 =18
Therefore average = $\frac{\left(18+4\right)}{2}=11$
Question 3: The sequence of categories — Art, Binders, Paper and Phones — in decreasing order of average processing time of their orders in this period is:
a) Art, Binders, Paper, Phones
b) Phones, Art, Binders, Paper
c) Phones, Binders, Art, Paper
d) Paper, Binders, Art, Phones
3) Answer (B)
Solution:
Accumulating all the data :
We get the following table :

Note a-b : represents the duration where a is the day when order is booked and b is the day when it is dispatched .
Now taking average processing time per order for the above mentioned categories we get :
Art =$\frac{2+8+2+1+7}{5}\ \ =4$
Binders =$\frac{1+1+11+2}{4}\ \ =3.75$
Papers = $\frac{3+2+5}{3}\ \ =3.33$
Phones =$\frac{2+12+1}{3}\ \ =5$
So in decreasing order we get Phones , Art ,Binder , Paper.
Question 4: Approximately what percentage of orders had a processing time of one day during the period Sep 1 to Sep 22 (both dates inclusive)?
a) 22%
b) 16%
c) 20%
d) 25%
4) Answer (C)
Solution:
Accumulating all the data :
We get the following table :

Note a-b : represents the duration where a is the day when order is booked and b is the day when it is dispatched .
Now from the table we observe that the total number of orders are 35 and 7 orders have a processing time of 1 unit
The 7 orders are : Arts Standard class,Binders First class and standard class, Phones First class, Bookcases second class ( 2 orders) and Chairs standard class.
So the percentage = $\frac{7}{35}\times\ 100\ =\ 20$
Instructions
The figure above shows the schedule of four employees – Abani, Bahni, Danni, and Tinni – whom Dhoni supervised in 2020. Altogether there were five projects which started and concluded in 2020 in which they were involved. For each of these projects and for each employee, the starting day was at the beginning of a month and the concluding day was the end of a month, and these are indicated by the left and right end points of the corresponding horizontal bars. The number within each bar indicates the percentage of assigned work completed by the employee for that project, as assessed by Dhoni.
For each employee, his/her total project-month (in 2020) is the sum of the number of months (s)he worked across the five projects, while his/her annual completion index is the weightage average of the completion percentage assigned from the different projects, with the weights being the corresponding number of months (s)he worked in these projects. For each project, the total employee-month is the sum of the number of months four employees worked in this project, while its completion index is the weightage average of the completion percentage assigned for the employees who worked in this project, with the weights being the corresponding number of months they worked in this project.
Question 5: Which of the following statements is/are true?
I: The total project-month was the same for the four employees.
II: The total employee-month was the same for the five projects.
a) Only II
b) Both I and II
c) Neither I nor II
d) Only I
5) Answer (D)
Solution:
The total project month is the number of months Abani, Bahni, Danni, and Tinni individually worked for all the projects combined :
Abani – 2+2+5 = 9 months
Bahni – 2+4+3 = 9 months
Danni – 3+3+2+1 = 9 months
Tinni – 2+2+3+2 = 9 months.
The total employee month for all the five projects is the sum of the total employee-month is the sum of the number of months four employees worked in this project.
Project -1 = 2+2+2 = 6 months
Project -2 = 3+2 = 5 months
Project – 3 = 2+4+3 = 9 months.
Project – 4 = 5+2+3 = 10 months.
Project – 5 = 3+1+2 = 6 months.
Only statement 1 is true.
Checkout: CAT Free Practice Questions and Videos
Question 6: Which employees did not work in multiple projects for any of the months in 2020?
a) Only Abani, Bahni and Danni
b) Only Abani and Bahni
c) All four of them
d) Only Tinni
6) Answer (A)
Solution:
Abani, Banni, and Danni did not work on multiple projects simultaneously in a month
Tinni was the only person who worked on multiple projects which are project 4 and project 5 in the month of september.
Question 7: The project duration, measured in terms of the number of months, is the time during which at least one employee worked in the project. Which of the following pairs of the projects had the same duration?
a) Project 1, Project 5
b) Project 4, Project 5
c) Project 3, Project 5
d) Project 3, Project 4
7) Answer (D)
Solution:
Considering the information provided :
For project 1 : 3 months.
Project – 2: 3 months.
Project – 3: 5 months.
Project – 4: 5 months.
Project – 5: 4 months.
Among the given options option D is true which is project 3, project 4.
Question 8: The list of employees in decreasing order of annual completion index is:
a) Danni, Tinni, Bahni, Abani
b) Bahni, Abani, Tinni, Danni
c) Danni, Tinni, Abani, Bahni
d) Tinni, Danni, Abani, Bahni
8) Answer (C)
Solution:
The annual completion index for different people is :
The weightage average of the completion percentage assigned from the different projects, with the weights being the corresponding number of months (s)he worked in these projects.
For Abani :
$\frac{\left(\left(100\cdot2\right)+\left(100\cdot2\right)+\left(80\cdot5\right)\right)}{2+2+5}=\ \frac{800}{9}$
For Bahni :
$\frac{\left(\left(100\cdot2\right)+\left(75\cdot4\right)+\left(90\cdot3\right)\right)}{2+3+4}=\ \frac{770}{9}$
For Danni :
$\frac{\left(\left(90\cdot3\right)+\left(100\cdot3\right)+\left(100\cdot2\right)+\left(100\cdot1\right)\right)}{2+3+2+1}=\ \frac{870}{9}$
For Tinni :
$\frac{\left(\left(80\cdot2\right)+\left(100\cdot2\right)+\left(100\cdot3\right)+\left(100\cdot2\right)\right)}{2+2+3+2}=\ \frac{860}{9}$
The descending order for the four people is :
Danni, Tinni, Abani, Bahni.
Instructions
DIRECTIONS for the following four questions:
A low-cost airline company connects ten India cities, A to J. The table below gives the distance between a pair of airports and the corresponding price charged by the company. Travel is permitted only from a departure airport to an arrival airport. The customers do not travel by a route where they have to stop at more than two intermediate airports.
<img “=”” alt=”” class=”img-responsive” src=”https://cracku.in/media/questionGroup/DI_6_3.png”/>
Question 9: What is the lowest possible fare, in rupees, from A to J?
a) 2275
b) 2850
c) 2890
d) 2930
e) 3340
9) Answer (A)
Solution:
From the table we can see that, the lowest price would be from A to H and H to J.
The cost of travel from A to H = Rs 1850
The cost of travel from H to J = Rs 425
Total cost = 1850 + 425 = Rs 2275.
Question 10: The company plans to introduce a direct flight between A and J. The market research results indicate that all its existing passengers travelling between A and J will use this direct flight if it is priced 5% below the minimum price that they pay at present. What should the company charge approximately, in rupees, for this direct flight?
a) 1991
b) 2161
c) 2707
d) 2745
e) 2783
10) Answer (B)
Solution:
From the table we can see that, the lowest price would be from A to H and H to J.
The cost of travel from A to H = Rs 1850
The cost of travel from H to J = Rs 425
Total cost = 1850 + 425 = Rs 2275
Lowest price = Rs 2275
95% of 2275 = Rs 2161
Checkout: CAT Free Practice Questions and Videos
Question 11: If the airports C, D and H are closed down owing to security reasons, what would be the minimum price, in rupees, to be paid by a passenger travelling from A to J?
a) 2275
b) 2615
c) 2850
d) 2945
e) 3190
11) Answer (C)
Solution:
If the airports C, D and H are closed down the minimum price to be paid by a passenger travelling from A to J would be by first travelling to F and then from F to J.
The cost of travel from A to F = Rs 1700
The cost of travel from F to J = Rs 1150
Total cost = 1700 + 1150 = Rs 2850
Question 12: If the prices include a margin of 10% over the total cost that the company incurs, what is the minimum cost per kilometer that the company incurs in flying from A to J?
a) 0.77
b) 0.88
c) 0.99
d) 1.06
e) 1.08
12) Answer (B)
Solution:
The minimum cost from A to J we know is 2275.
Let the CP to company be C
Since 10% over actual CP is the total price i.e. $\text{CP}\times1.1 = 2275 \rightarrow CP = \frac{2275}{1.1}$
The total distance is 1950+1400=2350 Km.
Cost per Km = $\dfrac{\frac{2275}{1.1}}{2350}$ = Rs 0.88/Km
Question 13: If the prices include a margin of 15% over the total cost that the company incurs, which among the following is the distance to be covered in flying from A to J that minimizes the total cost of travel for the company?
a) 2170
b) 2180
c) 2315
d) 2350
e) 2390
13) Answer (D)
Solution:
Even if If the prices include a margin of 15% over the total cost that the company incurs, the total cost company incurs would be minimum for route AHJ i.e 2350 km. Hence option D.
DILR Videos | Preparation Videos for CAT DILR
- Try Cracku Free CAT Mock Test, which come with detailed solutions and with video explanations.




![CAT Averages Questions PDF [Important Questions] CAT AVERAGES Questions PDF](https://cracku.in/blog/wp-content/uploads/2022/07/CAT-AVERAGES-Questions-PDF-218x150.png)
