
Venn Diagram Questions for CAT LRDI [Download PDF]
Venn Diagrams is an extremely important topic in the CAT LRDI section. Sets on Venn Diagrams frequently occur in the CAT. If you’re weak in this topic, make sure you are aware of the Concept of the Venn Diagrams. You can check out these CAT Venn Diagram questions from the CAT Previous year papers. Practice a good number of sets from the CAT Venn Diagram in the latest format of CAT LRDI Section. This post will look into some important Venn Diagram questions for CAT. You can download PDF of these Important Venn Diagram Questions for CAT LRDI (with detailed answers) along with the video solutions below, which are completely Free.
Download Venn Diagram Questions for CAT
Enroll for CAT 2022 Crash Course
Instructions
Read the following passage:
On a picnic trip of a company, 3 hotels Trident, Hilton and Park were booked for 90 employees. 6 of theemployees were willing to stay at any hotel. 12 wanted to stay in only Trident. 18 wanted to stay in onlyPark. Only Hilton had two times the employees as there were in Trident and Park only. Only Hilton and Parkhad three less than only Trident and Hilton. Also not more than 7 employees can stay in only Trident andHilton.
Question 1: How many employees can stay in Trident and Hilton only?
a) 4
b) 6
c) 7
d) 5
1) Answer (B)
Solution:

Now it is given that the total employees are 90, where $Y+3\le7\ $ or $Y\le4$
So, $39+3X+2Y\ =\ 90$
$3X+2Y\ =\ 51$
$X=\ \frac{\left(51-2Y\right)}{3}$
Now, since $Y\le4$, Y can only be 3.
Thus, X will be 15.
The number of employees in Trident and Hilton will be Y + 3 = 6.
Thus, the correct answer will be B.
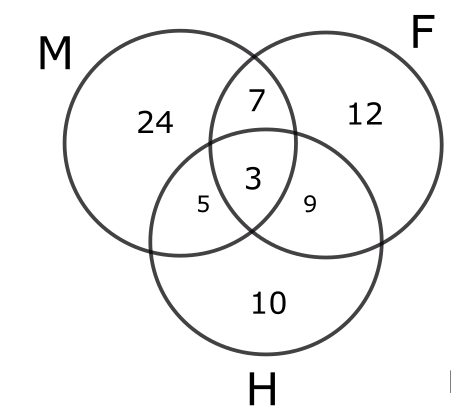
Question 2: A group of 78 people watch NDTV, Times Now and Republic. Out of these news channels, 36watch NDTV, 48 watch Times Now and 32 watches Republic. 14 people watch both NDTV and Times Now,20 people watch both Times Now and Republic, and 12 people watch both Republic and NDTV. Find the ratioof the number of people who watch only Times Now to the number of people who watch only Republic.
a) 9 : 4
b) 13 : 21
c) 11 : 4
d) 17 : 4
2) Answer (C)
Solution:
$P\left(A\ U\ B\ U\ C\right)=P\left(A\right)+P\left(B\right)+P\left(C\right)-\left\{P\left(A∩B\right)+P\left(B∩C\right)+P\left(C∩A\right)\right\}+P\left(A∩B∩C\right)$
Let the no. of people who watch all three be x
78= 36+48+32-(14+20+12)+x
or x= 8
No. of people who watch times now only = 48 – (14+20)+8 = 22
No. of people who watch republic only = 32 – (20+12) + 8 = 8
Ratio = 22/8 = 11:4
Question 3: In an organization with 70 employees, 30 are females and 30 employees are married. 24 employees hold a graduation degree. 19 married employees are graduates of which 7 are males. 12 males are graduates while 15 males are married. How many unmarried graduate females are employed in the organization?
1. 3
2. 5
3. 0
4. 1
a) 1
b) 2
c) 3
d) 4
3) Answer (C)
Solution:
Using the given information, the following table can be created.
.png)
We are told that the total number of employees with a graduation degree is 24.
The number of graduate males = married + unmarried = 7 + 5 = 12.
The number of married graduated females = 12.
Thus, the 24 graduated employees are among the male employees and married graduate female employees.
Thus, the number of unmarried graduate females = 0.
Hence, the answer is option C.
Instructions
A survey of 600 schools in India was conducted to gather information about their online teaching learning processes (OTLP). The following four facilities were studied.
F1: Own software for OTLP
F2: Trained teachers for OTLP
F3: Training materials for OTLP
F4: All students having Laptops
The following observations were summarized from the survey.
1. 80 schools did not have any of the four facilities – F1, F2, F3, F4.
2. 40 schools had all four facilities.
3. The number of schools with only F1, only F2, only F3, and only F4 was 25, 30, 26 and 20 respectively.
4. The number of schools with exactly three of the facilities was the same irrespective of which three were considered.
5. 313 schools had F2.
6. 26 schools had only F2 and F3 (but neither F1 nor F4).
7. Among the schools having F4, 24 had only F3, and 45 had only F2.
8. 162 schools had both F1 and F2.
9. The number of schools having F1 was the same as the number of schools having F4.
Question 4: What was the number of schools having only facilities F1 and F4?
4) Answer: 20
Solution:
Let the number of schools with exactly three of the facilities was the same irrespective of which three were considered be x.
Number of schools with none of the facilities be ‘n’ from 1, n=80.
Number of schools with only F1 and F2 be ‘b’
Number of schools with only F1 and F3 be ‘c’
Number of schools with only F1 and F4 be ‘d’
From the information given in the question we will get the following Venn diagram.
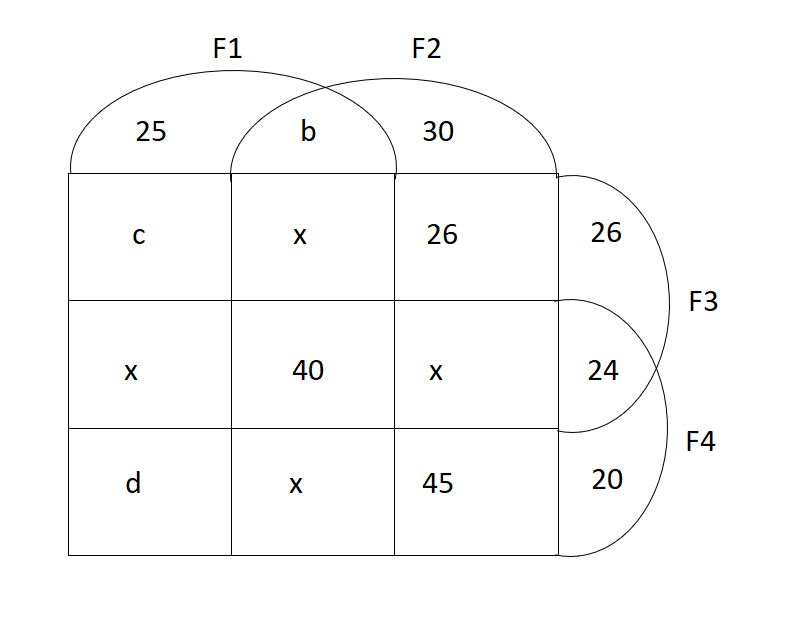
From 5, b+141+3x=313 => b+3x=172….(i)
From 8, b+x+40+x=162 => b+2x=122….(ii)
(ii)-(i) gives x=50 => b=22
From 9, 237+3x+c+d=279+3x=d => c=42
Total number of schools =600 => 313+25+c+x+d+26+24+20+80=600 => d=20.
The final table looks like:
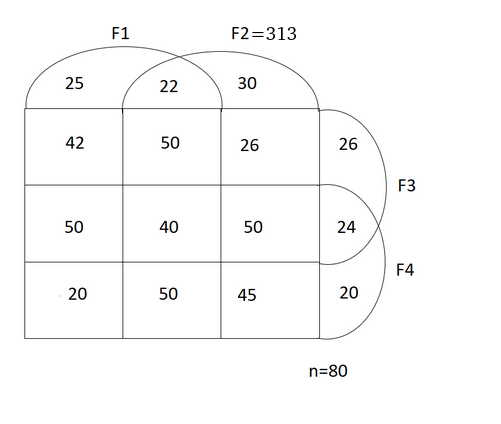
The total number of schools having only F1 and F4=20.
Question 5: What was the number of schools having only facilities F1 and F3?
5) Answer: 42
Solution:
Let the number of schools with exactly three of the facilities was the same irrespective of which three were considered be x.
Number of schools with none of the facilities be ‘n’ from 1, n=80.
Number of schools with only F1 and F2 be ‘b’
Number of schools with only F1 and F3 be ‘c’
Number of schools with only F1 and F4 be ‘d’
From the information given in the question we will get the following Venn diagram.
From 5, b+141+3x=313 => b+3x=172….(i)
From 8, b+x+40+x=162 => b+2x=122….(ii)
(ii)-(i) gives x=50 => b=22
From 9, 237+3x+c+d=279+3x=d => c=42
Total number of schools =600 => 313+25+c+x+d+26+24+20+80=600 => d=20.
The final table looks like:
The total number of schools having only F1 and F3= c=42
Question 6: What was the number of schools having facilities F2 and F4?
a) 185
b) 95
c) 45
d) 85
6) Answer (A)
Solution:
Let the number of schools with exactly three of the facilities was the same irrespective of which three were considered be x.
Number of schools with none of the facilities be ‘n’ from 1, n=80.
Number of schools with only F1 and F2 be ‘b’
Number of schools with only F1 and F3 be ‘c’
Number of schools with only F1 and F4 be ‘d’
From the information given in the question we will get the following Venn diagram.
From 5, b+141+3x=313 => b+3x=172….(i)
From 8, b+x+40+x=162 => b+2x=122….(ii)
(ii)-(i) gives x=50 => b=22
From 9, 237+3x+c+d=279+3x=d => c=42
Total number of schools =600 => 313+25+c+x+d+26+24+20+80=600 => d=20.
The final table looks like:
The total number of schools having facilities F4 and F2= 45+50+50+40=185.
Checkout: CAT Free Practice Questions and Videos
Question 7: What was the total number of schools having exactly three of the four facilities?
a) 64
b) 50
c) 200
d) 80
7) Answer (C)
Solution:
Let the number of schools with exactly three of the facilities was the same irrespective of which three were considered be x.
Number of schools with none of the facilities be ‘n’ from 1, n=80.
Number of schools with only F1 and F2 be ‘b’
Number of schools with only F1 and F3 be ‘c’
Number of schools with only F1 and F4 be ‘d’
From the information given in the question we will get the following Venn diagram.
From 5, b+141+3x=313 => b+3x=172….(i)
From 8, b+x+40+x=162 => b+2x=122….(ii)
(ii)-(i) gives x=50 => b=22
From 9, 237+3x+c+d=279+3x=d => c=42
Total number of schools =600 => 313+25+c+x+d+26+24+20+80=600 => d=20.
The final table looks like:
The total number of schools with exactly three of the four facilities= 4x=200.
Instructions
1000 patients currently suffering from a disease were selected to study the effectiveness of treatment of four types of medicines — A, B, C and D. These patients were first randomly assigned into two groups of equal size, called treatment group and control group. The patients in the control group were not treated with any of these medicines; instead they were given a dummy medicine, called placebo, containing only sugar and starch. The following information is known about the patients in the treatment group.
a. A total of 250 patients were treated with type A medicine and a total of 210 patients were treated with type C medicine.
b. 25 patients were treated with type A medicine only. 20 patients were treated with type C medicine only. 10 patients were treated with type D medicine only.
c. 35 patients were treated with type A and type D medicines only. 20 patients were treated with type A and type B medicines only. 30 patients were treated with type A and type C medicines only. 20 patients were treated with type C and type D medicines only.
d. 100 patients were treated with exactly three types of medicines.
e. 40 patients were treated with medicines of types A, B and C, but not with medicines of type D. 20 patients were treated with medicines of types A, C and D, but not with medicines of type B.
f. 50 patients were given all the four types of medicines. 75 patients were treated with exactly one type of medicine.
Question 8: The number of patients who were treated with medicine type D was:
8) Answer: 325
Solution:
Of the 1000 subjects, only 500 have been considered for the treatment. This constitutes our sample set. Thus the four drugs- A, B, C and D have been administered to this set of 500 individuals, while the rest 500 have been given the placebo. Based on the given information, we can then draw the following 4-set Venn diagram:
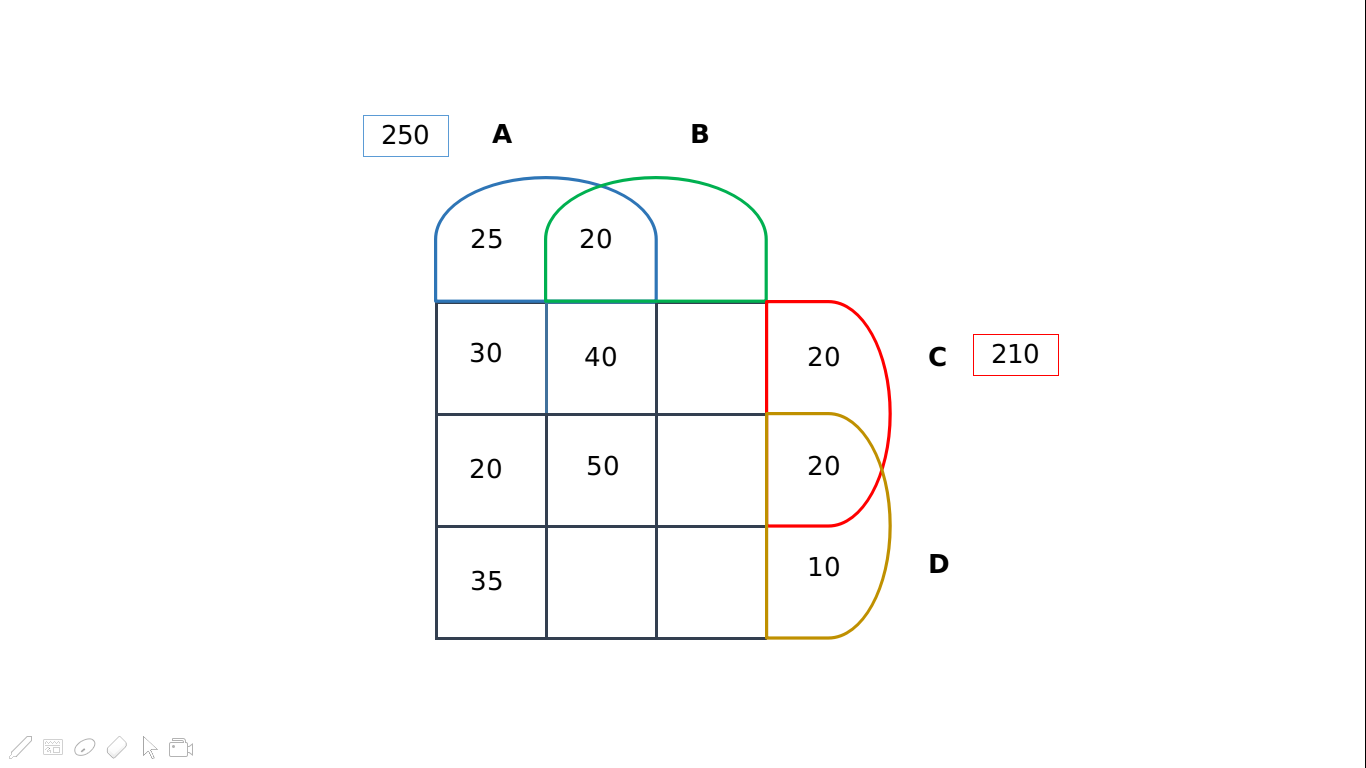
We can solve for the number of patients who were administered the drugs A, B and D excluding C by putting in the values for set A. The required value = 250 – (25+20+30+40+20+50+35) = 30. Based on condition (c), we know that 100 patients were treated with exactly three types of medicines. Thus, we can fill the slot for the number of patients who were administered only B, C and D excluding A by 100 – (40+20+30) = 10.
Similarly, based on condition (f), we know that the candidates who were administered only dug B are 75 – (25+20+10) = 20. Post this, we can easily calculate the number of people administered with only drugs B and C by 210 – (30+20+40+50+10+20+20) = 20. We can fill in the above values to obtain the following diagram:
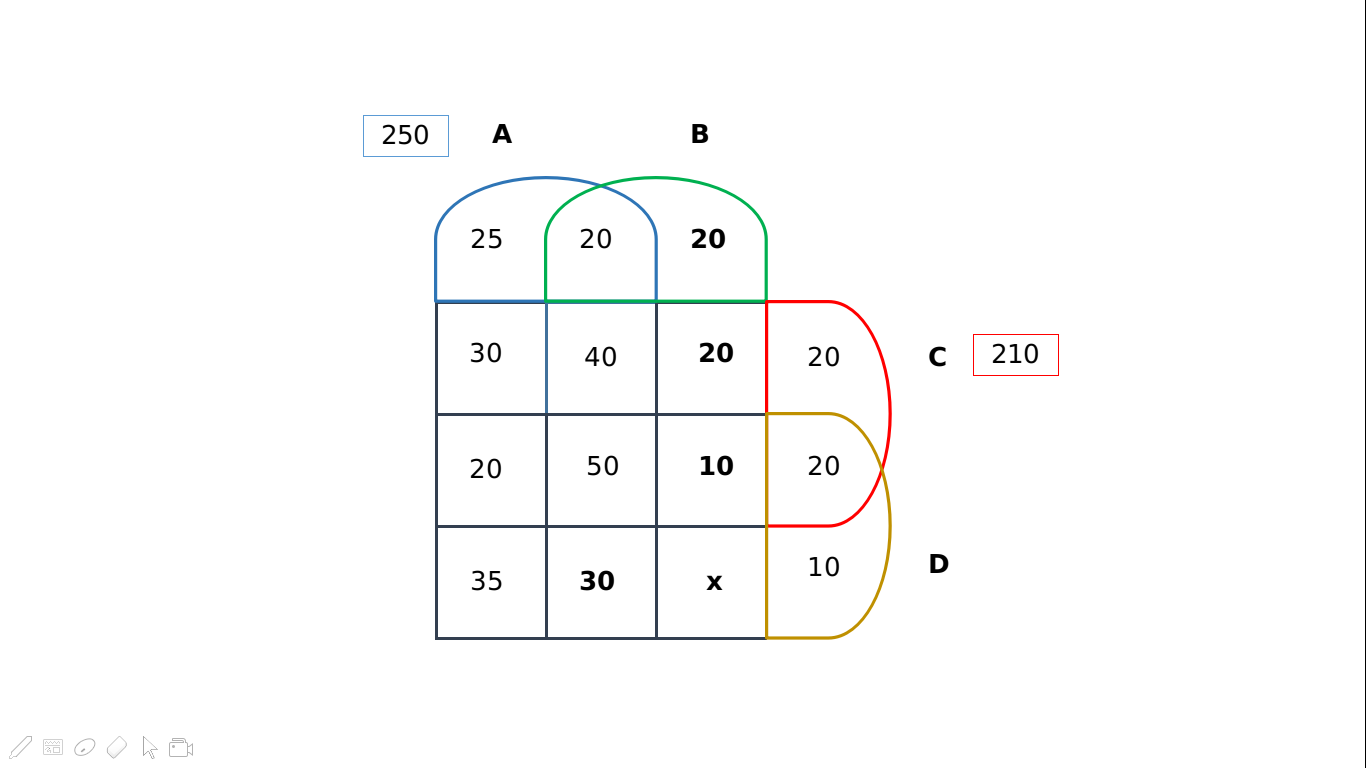
The sum of all the values should add up to 500. On solving for ‘x’ [which represents the number of people who were administered drugs B and D only], we obtain x = 150. The final representation would appear as follows:
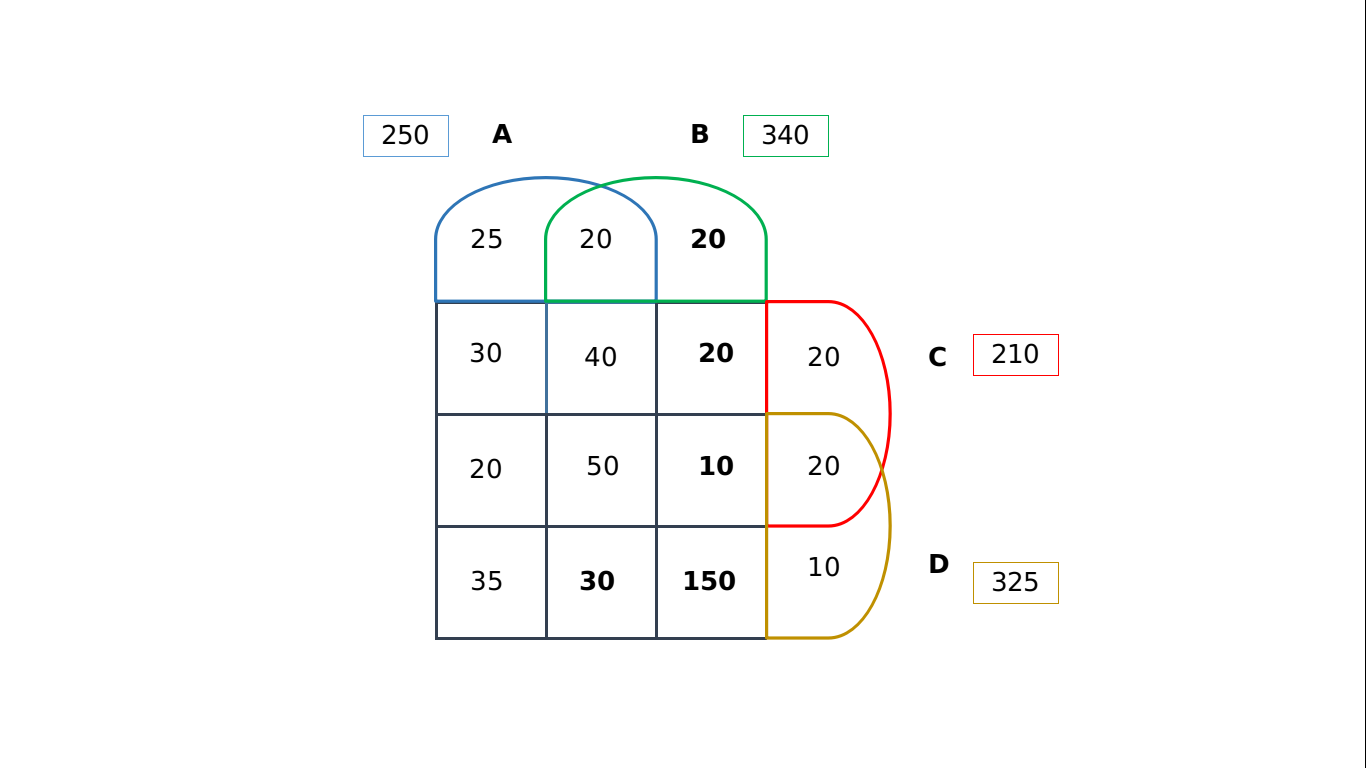
The number of patients who were treated with medicine type D was 325.
Question 9: How many patients were treated with medicine types B and D only?
9) Answer: 150
Solution:
Of the 1000 subjects, only 500 have been considered for the treatment. This constitutes our sample set. Thus the four drugs- A, B, C and D have been administered to this set of 500 individuals, while the rest 500 have been given the placebo. Based on the given information, we can then draw the following 4-set Venn diagram:
We can solve for the number of patients who were administered the drugs A, B and D excluding C by putting in the values for set A. The required value = 250 – (25+20+30+40+20+50+35) = 30. Based on condition (c), we know that 100 patients were treated with exactly three types of medicines. Thus, we can fill the slot for the number of patients who were administered only B, C and D excluding A by 100 – (40+20+30) = 10.
Similarly, based on condition (f), we know that the candidates who were administered only dug B are 75 – (25+20+10) = 20. Post this, we can easily calculate the number of people administered with only drugs B and C by 210 – (30+20+40+50+10+20+20) = 20. We can fill in the above values to obtain the following diagram:
The sum of all the values should add up to 500. On solving for ‘x’ [which represents the number of people who were administered drugs B and D only], we obtain x = 150. The final representation would appear as follows:
The number of people who were administered drugs B and D only were 150.
Question 10: The number of patients who were treated with medicine types B, C and D, but not type A was:
10) Answer: 10
Solution:
Of the 1000 subjects, only 500 have been considered for the treatment. This constitutes our sample set. Thus the four drugs- A, B, C and D have been administered to this set of 500 individuals, while the rest 500 have been given the placebo. Based on the given information, we can then draw the following 4-set Venn diagram:
We can solve for the number of patients who were administered the drugs A, B and D excluding C by putting in the values for set A. The required value = 250 – (25+20+30+40+20+50+35) = 30. Based on condition (c), we know that 100 patients were treated with exactly three types of medicines. Thus, we can fill the slot for the number of patients who were administered only B, C and D excluding A by 100 – (40+20+30) = 10.
Similarly, based on condition (f), we know that the candidates who were administered only dug B are 75 – (25+20+10) = 20. Post this, we can easily calculate the number of people administered with only drugs B and C by 210 – (30+20+40+50+10+20+20) = 20. We can fill in the above values to obtain the following diagram:
The sum of all the values should add up to 500. On solving for ‘x’ [which represents the number of people who were administered drugs B and D only], we obtain x = 150. The final representation would appear as follows:
The number of patients who were treated with medicine types B, C and D, but not type A was: 10.
Question 11: How many patients were treated with medicine type B?
11) Answer: 340
Solution:
Of the 1000 subjects, only 500 have been considered for the treatment. This constitutes our sample set. Thus the four drugs- A, B, C and D have been administered to this set of 500 individuals, while the rest 500 have been given the placebo. Based on the given information, we can then draw the following 4-set Venn diagram:
We can solve for the number of patients who were administered the drugs A, B and D excluding C by putting in the values for set A. The required value = 250 – (25+20+30+40+20+50+35) = 30. Based on condition (c), we know that 100 patients were treated with exactly three types of medicines. Thus, we can fill the slot for the number of patients who were administered only B, C and D excluding A by 100 – (40+20+30) = 10.
Similarly, based on condition (f), we know that the candidates who were administered only dug B are 75 – (25+20+10) = 20. Post this, we can easily calculate the number of people administered with only drugs B and C by 210 – (30+20+40+50+10+20+20) = 20. We can fill in the above values to obtain the following diagram:
The sum of all the values should add up to 500. On solving for ‘x’ [which represents the number of people who were administered drugs B and D only], we obtain x = 150. The final representation would appear as follows:
Based on the above, the number of patients who were treated with medicine type B is equal to 340.
Instructions
Ten musicians (A, B, C, D, E, F, G, H, I and J) are experts in at least one of the following three percussion instruments: tabla, mridangam, and ghatam. Among them, three are experts in tabla but not in mridangam or ghatam, another three are experts in mridangam but not in tabla or ghatam, and one is an expert in ghatam but not in tabla or mridangam. Further, two are experts in tabla and mridangam but not in ghatam, and one is an expert in tabla and ghatam but not in mridangam.
The following facts are known about these ten musicians.
1. Both A and B are experts in mridangam, but only one of them is also an expert in tabla.
2. D is an expert in both tabla and ghatam.
3. Both F and G are experts in tabla, but only one of them is also an expert in mridangam.
4. Neither I nor J is an expert in tabla.
5. Neither H nor I is an expert in mridangam, but only one of them is an expert in ghatam.
Question 12: If C is an expert in mridangam and F is not, then which are the three musicians who are experts in tabla but not in either mridangam or ghatam?
a) E, F and H
b) C, G and H
c) E, G and H
d) C, E and G
12) Answer (A)
Solution:
Based on the given information, we can form the following Venn-diagram for ease of understanding:
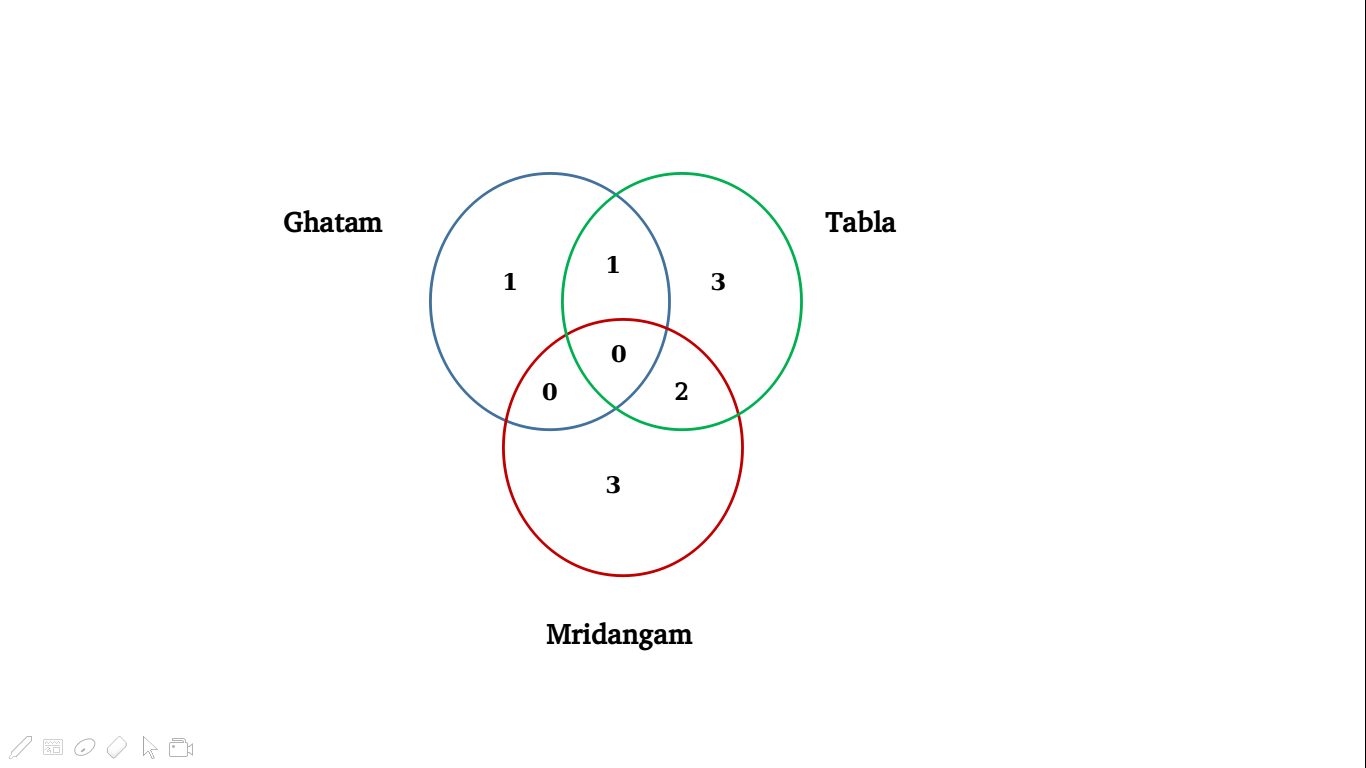
The conditions help us to bifurcate the individuals based on their expertise –
Mridangam: A and B (condition 1); one out of F and G (condition 3)
Tabla: one out of A and B (condition 1); F and G (condition 3); D (condition 2)
Ghatam: D (condition 2)
Based on condition 4, we infer that ‘I’ and ‘J’ are either experts in Ghatam or Mridangam. However, condition 5 adds that ‘I’ is not an expert in Mridangam. This helps us definitively zero-in on ‘I’ as an expert in Ghatam. Since ‘I’ is a Ghatam expert, J is an expert in Mridangam, and ‘H’ is an expert in Tabla [based on conditions 4 and 5]. Thus, we can depict our understanding so far as follows:
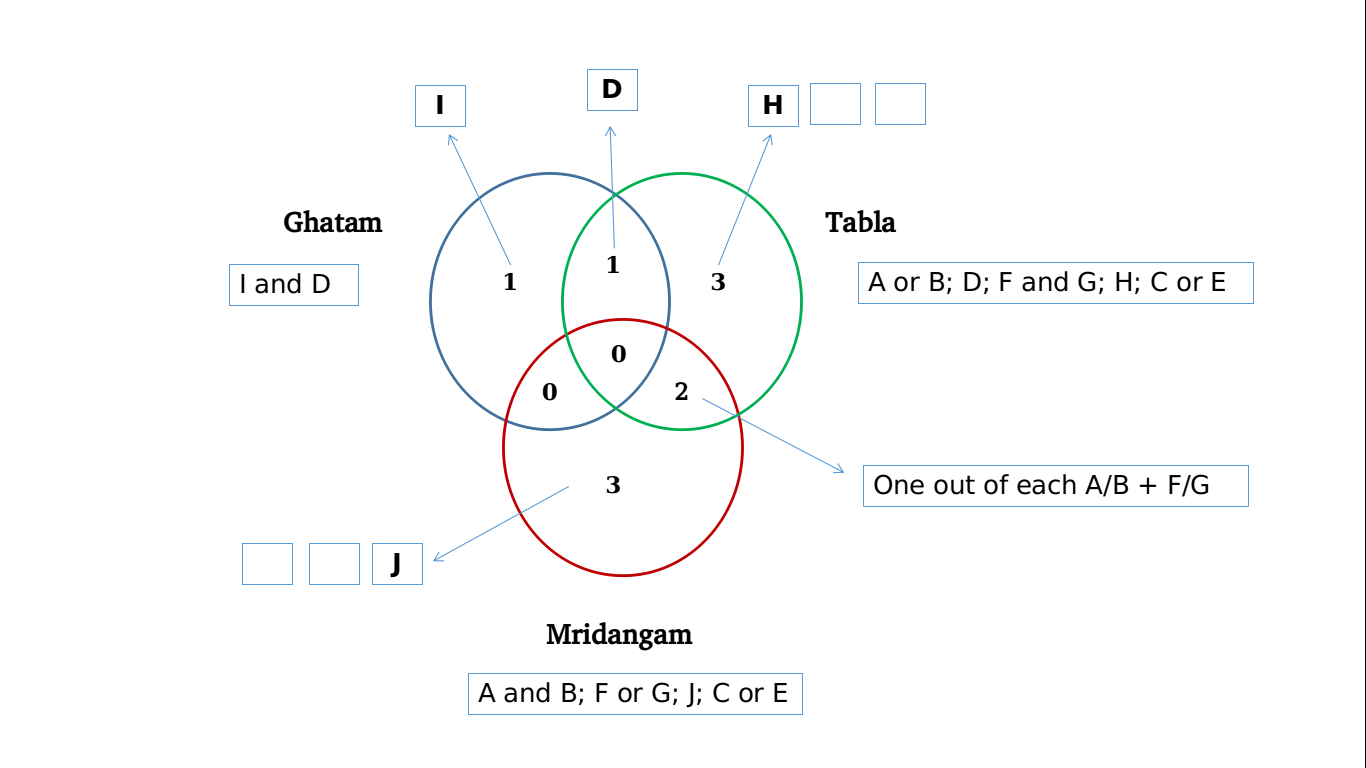
Mridangam [total: 5] – A and B (condition 1); one out of F and G (condition 3); J (condition 4 and 5); one out of C and E {remaining experts}
Tabla [total: 6] – one out of A and B (condition 1); F and G (condition 3); D (condition 2); H (condition 4 and 5); one out of C and E {remaining experts}
Ghatam [total: 2] – D (condition 2); I (condition 4 and 5)
If C is an expert in Mridangam, E has to be an expert in Tabla. Additionally, if F is not an expert in Mridangam, he has to be an expert only in Tabla while G will be an expert in both Tabla and Mridangam.
Tabla [total: 6] – one out of A and B (condition 1); F and G (condition 3); D (condition 2); H (condition 4 and 5); E {based on the condition given in the question}
Of these experts, A, B and G are experts of Mridangam and D is an expert of Ghatam as well. Thus, excluding these, we have F, H and E who are the experts solely in Tabla. Thus, Option A is the correct answer.
Question 13: Which of the following pairs CANNOT have any musician who is an expert in both tabla and mridangam but not in ghatam?
a) F and G
b) C and E
c) A and B
d) C and F
13) Answer (B)
Solution:
Based on the given information, we can form the following Venn-diagram for ease of understanding:
The conditions help us to further bifurcate the individuals based on their expertise.
Mridangam: A and B (condition 1); one out of F and G (condition 3)
Tabla: one out of A and B (condition 1); F and G (condition 3); D (condition 2)
Ghatam: D (condition 2)
Based on condition 4, we infer that ‘I’ and ‘J’ are either experts in Ghatam or Mridangam. However, condition 5 adds that ‘I’ is not an expert in Mridangam. This helps us definitively zero-in on ‘I’ as an expert in Ghatam. Since ‘I’ is a Ghatam expert, J is an expert in Mridangam and ‘H’ is an expert in Tabla [based on conditions 4 and 5]. Thus, we can depict our understanding so far as follows:
Mridangam [total: 5] – A and B (condition 1); one out of F and G (condition 3); J (condition 4 and 5); one out of C and E {remaining experts}
Tabla [total: 6] – one out of A and B (condition 1); F and G (condition 3); D (condition 2); H (condition 4 and 5); one out of C and E {remaining experts}
Ghatam [total: 2] – D (condition 2); I (condition 4 and 5)
We observe that the pair C and E cannot have any musician who is an expert in both tabla and mridangam but not in ghatam. Hence, Option B is the correct answer.
Question 14: Who among the following is DEFINITELY an expert in mridangam but not in either tabla or ghatam?
a) B
b) J
c) G
d) E
14) Answer (B)
Solution:
Based on the given information, we can form the following Venn-diagram for ease of understanding:
The conditions help us to further bifurcate the individuals based on their expertise.
Mridangam: A and B (condition 1); one out of F and G (condition 3)
Tabla: one out of A and B (condition 1); F and G (condition 3); D (condition 2)
Ghatam: D (condition 2)
Based on condition 4, we infer that ‘I’ and ‘J’ are either experts in Ghatam or Mridangam. However, condition 5 adds that ‘I’ is not an expert in Mridangam. This helps us definitively zero-in on ‘I’ as an expert in Ghatam. Since ‘I’ is a Ghatam expert, J is an expert in Mridangam and ‘H’ is an expert in Tabla [based on conditions 4 and 5]. Thus, we can depict our understanding so far as follows:
Mridangam [total: 5] – A and B (condition 1); one out of F and G (condition 3); J (condition 4 and 5); one out of C and E {remaining experts}
Tabla [total: 6] – one out of A and B (condition 1); F and G (condition 3); D (condition 2); H (condition 4 and 5); one out of C and E {remaining experts}
Ghatam [total: 2] – D (condition 2); I (condition 4 and 5)
Thus, we observe that J is definitely an expert in mridangam but not in either tabla or ghatam. Hence, Option B is the correct answer.
Question 15: Who among the following is DEFINITELY an expert in tabla but not in either mridangam or ghatam?
a) F
b) C
c) A
d) H
15) Answer (D)
Solution:
Based on the given information, we can form the following Venn-diagram for ease of understanding:
The conditions help us to further bifurcate the individuals based on their expertise.
Mridangam: A and B (condition 1); one out of F and G (condition 3)
Tabla: one out of A and B (condition 1); F and G (condition 3); D (condition 2)
Ghatam: D (condition 2)
Based on condition 4, we infer that ‘I’ and ‘J’ are either experts in Ghatam or Mridangam. However, condition 5 adds that ‘I’ is not an expert in Mridangam. This helps us definitively zero-in on ‘I’ as an expert in Ghatam. Since ‘I’ is a Ghatam expert, J is an expert in Mridangam and ‘H’ is an expert in Tabla [based on conditions 4 and 5]. Thus, we can depict our understanding so far as follows:
Mridangam [total: 5] – A and B (condition 1); one out of F and G (condition 3); J (condition 4 and 5); one out of C and E {remaining experts}
Tabla [total: 6] – one out of A and B (condition 1); F and G (condition 3); D (condition 2); H (condition 4 and 5); one out of C and E {remaining experts}
Ghatam [total: 2] – D (condition 2); I (condition 4 and 5)
Thus, we observe that H is definitely an expert in tabla but not in either mridangam or ghatam. Hence, Option D is the correct answer.
Instructions
Direction : Answer the questions based on the information provided.
In an organisation with three departments i.e. Marketing, Finance and HR, it was decided to shuffle the 70 employees between departments. To make optimum use of resources, the management assesses their capability based on their qualification. 3 employees can work in every department. 7 employees can work in Finance and Marketing only. 10 can work only in HR while the number of employees only in Marketing is double of that in only Finance. Employees in only Finance cannot be less than 10 while employees in Finance and HR only are three times of two less than that of Marketing and HR only. The organisation has employees with all possible combinations of their capabilities.
Question 16: How many employees at the maximum are capable to work in Finance ?
a) 31
b) 33
c) 28
d) 32
16) Answer (A)
Solution:
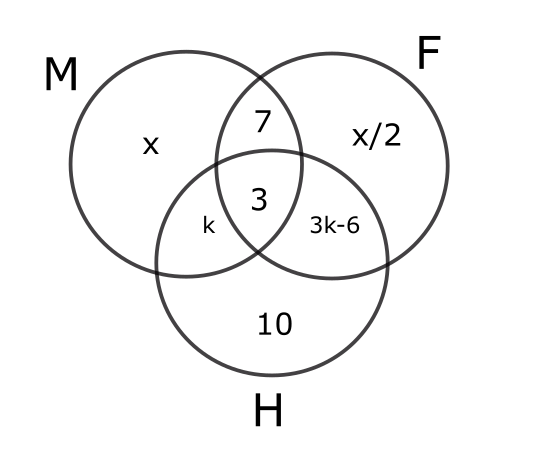
We know that x+x/2+k+3+3k-6+10=70
$\frac{\ 3x}{2}$ +4l =56
The solutions possible are x=24, k=5 and x=32 and k=2. But if k=2 then, only finance and hr would have 0. This is not possible as the question states that there exists employees in all possible combinations.
Finance has 31 people.
Question 17: How many employees are capable to work in Marketing and HR only ?
a) 1
b) 2
c) 5
d) 7
17) Answer (C)
Solution:
We know that x+x/2+k+3+3k-6+10+7=70
$\frac{\ 3x}{2}$ +4k =56
The solutions possible are x=24, k=5 and x=32 and k=2. But if k=2 then, only finance and hr would have 0. This is not possible as the question states that there exists employees in all possible combinations.
The number of employees in only marketing and HR is 5.
Instructions
Students in a college are discussing two proposals —
A: a proposal by the authorities to introduce dress code on campus, and
B: a proposal by the students to allow multinational food franchises to set up outlets on college campus.
A student does not necessarily support either of the two proposals.
In an upcoming election for student union president, there are two candidates in fray:
Sunita and Ragini. Every student prefers one of the two candidates.
A survey was conducted among the students by picking a sample of 500 students. The following information was noted from this survey.
1. 250 students supported proposal A and 250 students supported proposal B.
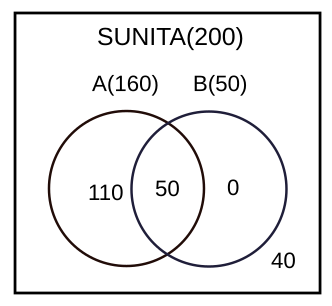
2. Among the 200 students who preferred Sunita as student union president, 80% supported proposal A.
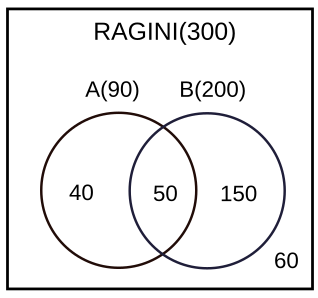
3. Among those who preferred Ragini, 30% supported proposal A.
4. 20% of those who supported proposal B preferred Sunita.
5. 40% of those who did not support proposal B preferred Ragini.
6. Every student who preferred Sunita and supported proposal B also supported proposal A.
7. Among those who preferred Ragini, 20% did not support any of the proposals.
Question 18: How many of the students surveyed supported proposal B, did not support proposal A and preferred Ragini as student union president?
a) 150
b) 210
c) 200
d) 40
18) Answer (A)
Solution:
Total number of students surveyed= 500
Every student prefers one of the two candidates. Ragini(R) and Sunita(S).
Thus, R+S=500.
According to statement 2, “Among the 200 students who preferred Sunita as student union president, 80% supported proposal A.”
The number of students who support Sunita(S)=200
The number of students who supported Ragini(R)=300
According to statements 2 and 3, 160 students who supported Sunita also supported the proposal A & 90 students who supported Ragini also supported proposal A.
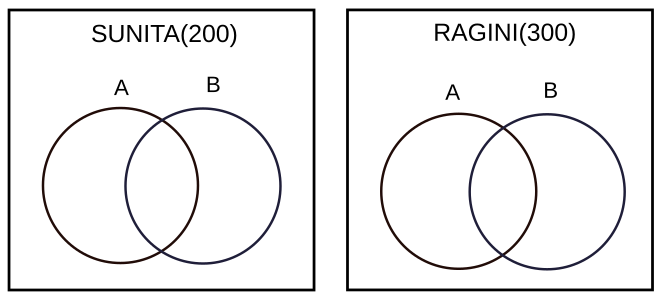
According to statements 4 and 6, we can make the following Venn diagram for Sunita.
According to statement 5 and 7, we can make the following Venn diagram.
From the diagram, we can understand that option A is correct.
Question 19: What percentage of the students surveyed who supported both proposals A and B preferred Sunita as student union president?
a) 40
b) 25
c) 20
d) 50
19) Answer (D)
Solution:
Total number of students surveyed= 500
Every student prefers one of the two candidates. Ragini(R) and Sunita(S).
Thus, R+S=500.
According to statement 2, “Among the 200 students who preferred Sunita as student union president, 80% supported proposal A.”
The number of students who support Sunita(S)=200
The number of students who supported Ragini(R)=300
According to statements 2 and 3, 160 students who supported Sunita also supported the proposal A & 90 students who supported Ragini also supported proposal A.
According to statements 4 and 6, we can make the following Venn diagram for Sunita.
According to statement 5 and 7, we can make the following Venn diagram.
According to the Venn diagram, the students surveyed who supported both proposals A and B preferred Sunita as student union president $\frac{50}{50+50}$ % =50%
Question 20: What percentage of the students surveyed who did not support proposal A preferred Ragini as student union president?
20) Answer: 84
Solution:
Total number of students surveyed= 500
Every student prefers one of the two candidates. Ragini(R) and Sunita(S).
Thus, R+S=500.
According to statement 2, “Among the 200 students who preferred Sunita as student union president, 80% supported proposal A.”
The number of students who support Sunita(S)=200
The number of students who supported Ragini(R)=300
According to statements 2 and 3, 160 students who supported Sunita also supported the proposal A & 90 students who supported Ragini also supported proposal A.
According to statements 4 and 6, we can make the following Venn diagram for Sunita.
According to statement 5 and 7, we can make the following Venn diagram.
The percentage of the students surveyed who did not support proposal A preferred Ragini as student union president = 210/250=84%
Answer 84
Question 21: Among the students surveyed who supported proposal A, what percentage preferred Sunita for student union president?
21) Answer: 64
Solution:
Total number of students surveyed= 500
Every student prefers one of the two candidates. Ragini(R) and Sunita(S).
Thus, R+S=500.
According to statement 2, “Among the 200 students who preferred Sunita as student union president, 80% supported proposal A.”
The number of students who support Sunita(S)=200
The number of students who supported Ragini(R)=300
According to statements 2 and 3, 160 students who supported Sunita also supported the proposal A & 90 students who supported Ragini also supported proposal A.
According to statements 4 and 6, we can make the following Venn diagram for Sunita.
According to statement 5 and 7, we can make the following Venn diagram.
The number of students who preferred Sunita and the proposal A=160
=160/250= 64%


