
DI with Connected Data Sets is one of the important topics in the CAT LRDI section. These questions are not very tough if you practise enough number of sets. Firstly, understand the concept of DI with Connected Data Sets. Solve & practice more sets from CAT DI with Connected Data Sets so that you get a hang of these questions. You can check out these CAT DI with Connected data Sets questions from the CAT Previous year papers. In this post, we will look into some important DI with Connected Data Sets Questions for CAT. These are a good source of practice for CAT preparation; If you want to practice these questions, you can download these Important DI with Connected Data Sets Questions for CAT (with detailed answers) PDF along with the video solutions below, which is completely Free.
Download DI with Connected Data Sets Questions for CAT
Enroll for CAT 2022 Online Course
Instructions
b. You can buy books from supermarket,
c. You can order books over the Internet (Online).
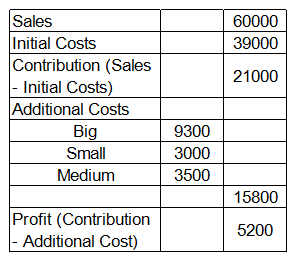
Your manager has an interesting way of classifying expenses: some of the expenses are classified in terms of size: Big, Small and Medium; and others are classified in terms of the colors, Red, Yellow, Green and Violet. The company has a history of categorizing overall costs into initial costs and additional costs. Additional costs are equal to the sum of Big, Small and Medium expenses. There are two types of margins, contribution (sales minus initial costs) and profit (contribution minus additional costs). Given below is the data about sales and costs of BnC:
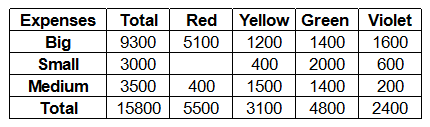
Each of the Big, Small and Medium cost is categorized by the manager into Red, Yellow, Green and Violet costs. Breakdown of the additional costs under these headings is shown in the table below:
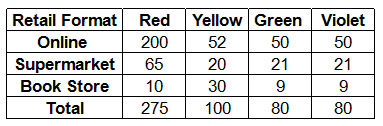
Red, Yellow, Green and Violet costs are allocated to different retail formats. These costs are apportioned in the ratio of number of units consumed by each retail format. The number of units consumed by each retail format is given in the table below:
Question 1: Which retail format gives the highest profit for BnC?
a) BookStore
b) Supermarket
c) Online
d) All are equally profitable.
e) Cannot be determined from given information.
1) Answer (A)
Solution:
Sales from online = 50% of total sales = 50% of 60000 = 30000
The ratio of supermarket sales and book store sales is 1:2
Supermarket sales = (30000*1)/3 = 10000
Bookstore sales = (30000*2)/3 = 20000
Initial costs for online = 50% of total initial costs (Initial cost is allocated in ratio of sales)
= 50% of 39000 = 19500
Initial costs for supermarket = (19500*1)/3 = 6500 (Initial cost is allocated in ratio of sales)
Initial costs for bookstore = (19500*2)/3 = 13000
For online:
Additional costs = Red + Yellow + Green + Violet for online) ….(1)
Total red costs = 5500
Red costs for online = 5500*(200/275) = 4000
Similarly,
Yellow costs for online = 3100*(52/100) = 1612
Green costs for online = 4800*(50/80) = 3000
Violets costs for online = 2400*(50/80) = 1500
Addition costs for online = 4000+1612+3000+1500 = 10112 From (1)
Profit = Sales – Initial costs – Additional costs = 30000-19500- 10112 = 388
For Supermarket:
Additional costs = Red + Yellow + Green + Violet
= 5500*(65/275) + 3100*(20/100) +4800*(21/80)+2400*(21/80) = 3810
Profit = 10000-6500- 3810
= -310
For Bookstore:
Additional costs = Red + Yellow + Green + Violet
= 5500*(10/275) + 3100*(30/100) +4800*(9/80)+2400*(9/80)
Profit = 20000-13000-1940 = 5060
Bookstore gives highest profit for BnC.
Question 2: Which retail format is least profit making for BnC?
a) Online
b) Supermarket
c) Book Store
d) All formats are loss making. E. All formats are profit making.
2) Answer (B)
Solution:
Sales from online = 50% of total sales = 50% of 60000 = 30000
The ratio of supermarket sales and book store sales is 1:2
Supermarket sales = (30000*1)/3 = 10000
Bookstore sales = (30000*2)/3 = 20000
Initial costs for online = 50% of total initial costs (Initial cost is allocated in ratio of sales)
= 50% of 39000 = 19500
Initial costs for supermarket = (19500*1)/3 = 6500 (Initial cost is allocated in ratio of sales)
Initial costs for bookstore = (19500*2)/3 = 13000
For online:
Additional costs = Red + Yellow + Green + Violet for online) ….(1)
Total red costs = 5500
Red costs for online = 5500*(200/275) = 4000
Similarly,
Yellow costs for online = 3100*(52/100) = 1612
Green costs for online = 4800*(50/80) = 3000
Violets costs for online = 2400*(50/80) = 1500
Addition costs for online = 4000+1612+3000+1500 = 10112 From (1)
Profit = Sales – Initial costs – Additional costs = 30000-19500- 10112 = 388
For Supermarket:
Additional costs = Red + Yellow + Green + Violet
= 5500*(65/275) + 3100*(20/100) +4800*(21/80)+2400*(21/80) = 3810
Profit = 10000-6500- 3810
= -310
For Bookstore:
Additional costs = Red + Yellow + Green + Violet
= 5500*(10/275) + 3100*(30/100) +4800*(9/80)+2400*(9/80)
Profit = 20000-13000-1940 = 5060
Supermarket is making least profit for BnC.
Question 3: What is the profit/loss from “online” sales? (Use data from previous question if needed)
a) 0
b) -310
c) +20
d) +388
e) Cannot be determined from given information
3) Answer (D)
Solution:
Sales from online = 50% of total sales = 50% of 60000 = 30000
Initial costs for online = 50% of total initial costs (Initial cost is allocated in ratio of sales)
= 50% of 39000 = 19500
Additional costs = Red + Yellow + Green + Violet for online) ….(1)
Total red costs = 5500
Red costs for online = 5500*(200/275) = 4000
Similarly,
Yellow costs for online = 3100*(52/100) = 1612
Green costs for online = 4800*(50/80) = 3000
Violets costs for online = 2400*(50/80) = 1500
Addition costs for online = 4000+1612+3000+1500 = 10112 From (1)
Profit = Sales – Initial costs – Additional costs = 30000-19500- 10112 = 388
Question 4: Read the following statements:
Statement I. Online store accounted for 50% of the sales at BnC and the ratio of supermarket sales and book store sales is 1:2.
Statement II. Initial Cost is allocated in the ratio of sales. If you want to calculate the profit/loss from the different retail formats, then
a) Statement I alone is sufficient to calculate the profit/loss.
b) Statement II alone is sufficient to calculate the profit/loss.
c) Both statements I and Il are required to calculate the profit/loss.
d) Either of the two statements is sufficient to calculate the profit/loss.
e) Neither Statement I nor Statement Il is sufficient to calculate the profit/loss.
4) Answer (C)
Solution:
Sales for online = 50% of 60000 = 30000
Remaining sales = 60000-30000 = 30000
The ratio of supermarket sales and book store sales is 1:2
Supermarket sales = (30000*1)/3 = 10000
Bookstore sales = (30000*2)/3 = 20000
Profit = Sales – Initial costs – Additional costs
Sales and Additional costs can be calculated from the table. But no information about distribution of initial costs among different retails formats. From statement 2 the distribution of initial costs is clear.
Hence both statements will be used to calculate profit for different retail formats.
Instructions
Answer the questions based on the following information. Mulayam Software Co., before selling a package to its clients, follows the given schedule.
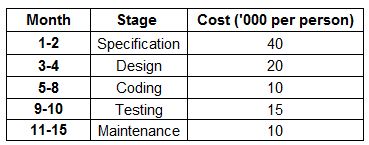
The number of people employed in each month is:

Question 5: Which five consecutive months have the lowest average cost per man-month under the new technique?
a) 1-5
b) 9-13
c) 11-15
d) None of these
5) Answer (C)
Solution:
Lowest cost per person is for coding and maintenance i.e. 10 rs.
But for consecutive five months avg. for coding and any other will be more than consecutive 5 months for maintenance.
So avg. cost for five months of maintenance is = $\frac{(3+3+1+1+1) \times 10}{9} = 10$
Which is lowest among all others
Checkout: CAT Free Practice Questions and Videos
Question 6: Under the new technique, which stage of software development is most expensive for Mulayam Software Co.?
a) Testing
b) Specification
c) Coding
d) Design
6) Answer (D)
Solution:
Total incurred cost for testing = $(4+1)\times 15 = 75$
Incurred cost for specification = $(2+3) \times 40 = 200$
Incurred cost for coding = $(4+5+5) \times 10 = 140$
Incurred cost for design = $(3+4+5) \times 20 = 240$
Hence design is most expensive for the company.
Question 7: What is the difference in cost between the old and the new techniques?
a) Rs. 30,000
b) Rs. 60,000
c) Rs. 70,000
d) Rs. 40,000
7) Answer (B)
Solution:
In new technique, increment in 5th month cost (‘000) = $(5 \times 20 – 4 \times 10)$ = 60
Question 8: With reference to the above question, what is the cost incurred in the new ‘coding’ stage? (Under the new technique, 4 people work in the sixth month and 5 in the eighth.)
a) Rs. 1,40,000
b) Rs. 1,50,000
c) Rs. 1,60,000
d) Rs. 1,70,000
8) Answer (A)
Solution:
As coding is done in 6-8 months,
So total person employed = 4+5+5 = 14
cost per person for 6-8 month = 10000
Total cost will be = $(14 \times 10000)$ = 140,000
Question 9: Due to overrun in ‘design’, the design stage took 3 months, i.e. months 3, 4 and 5. The number of people working on design in the fifth month was 5. Calculate the percentage change in the cost incurred in the fifth month. (Due to improvement in ‘coding’ technique, this stage was completed in months 6-8 only.)
a) 225%
b) 150%
c) 275%
d) 240%
9) Answer (B)
Solution:
In given table, value of cost for 5th month = $(N) \times (C)$ (No.of employer for 5th month = N and cost per person for 5th month = C)
So value of cost for 5th month before overrun = $4 \times 10 = 40$
value of cost for 5th month after overrun = $ 5 \times 20 = 100 $
Change = 60
%change = $\frac{60}{40} \times 100$ = 150
Instructions
The table below gives the achievements of Agricultural Development Programmes from 1983 – 84 to 1988 – 89. Study the following table and for each of the following questions, choose the best alternative.

Irrigation (Cumulative in Million Hectares)

High yielding varieties (Million Hectares)

Consumption of chemical fertilizers

Gross Cropped area (Million hectares)

Question 10: It is possible that a part of the minor irrigated area is brought under major and medium areas. In which year has this definitely happened?
a) 1984 – 85
b) 1985 – 86
c) 1986 – 87
d) 1987 – 88
10) Answer (D)
Solution:
There is a decrease in the area of minor irrigation land in 1987-88.
Hence, during this year land is brought into maor irrigation area.
Question 11: How much area, in million hectares, was brought under irrigation during the year 1986-87?
a) 58.20
b) 1.43
c) 0.80
d) 2.23
11) Answer (D)
Solution:
In Major and Medium = 24 – 23.2 = 0.8 million hectares
In Minor = 34.2 – 32.77 = 1.43 million hectares
In total, 2.23 million hectares.
Question 12: In which year does the area cropped under high yielding varieties show a decline for the maximum number of crops?
a) 1988 – 89
b) 1985 – 86
c) 1986 – 87
d) None of these
12) Answer (A)
Solution:
The answer is 1988-89 as there were three crops which declined during this period: Wheat, Jowar, Bajra.
Question 13: The consumption of chemical fertilizer per hectare of gross cropped area is lowest for the year
a) 1984 – 85
b) 1985 – 86
c) 1986 – 87
d) 1987 – 88
13) Answer (A)
Solution:

Hence, the lowest ratio will be for 84-85.
Instructions
The first table gives the number of saris (of all the eight colours) stocked in six regional showrooms. The second gives the number of saris (of all the eight colours) sold in these six regional showrooms. The third table gives the percentage of saris sold to saris stocked for each colour in each region. The fourth table gives the percentage of saris of a specific colour sold within that region. The fifth table gives the percentage of saris of a specific colour sold across all the regions. Study the tables and for each of the following questions, choose the best alternative.
Table 1
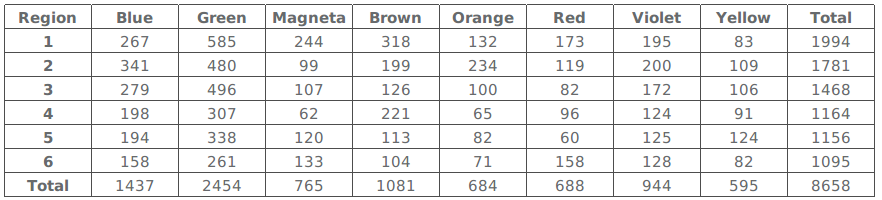
Table 2
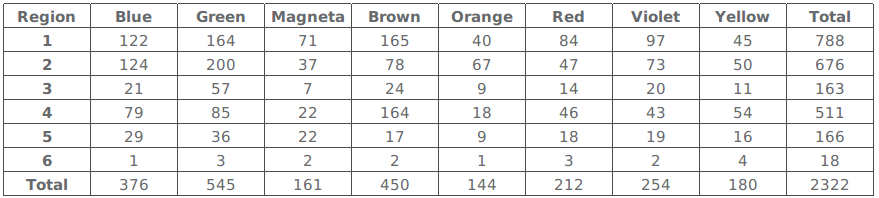
Table 3
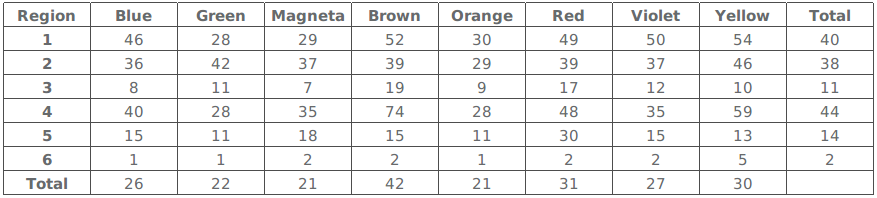
Table 4
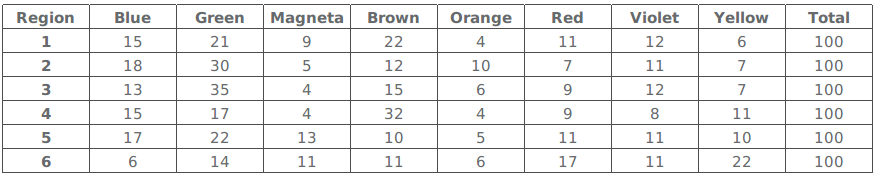
Table 5
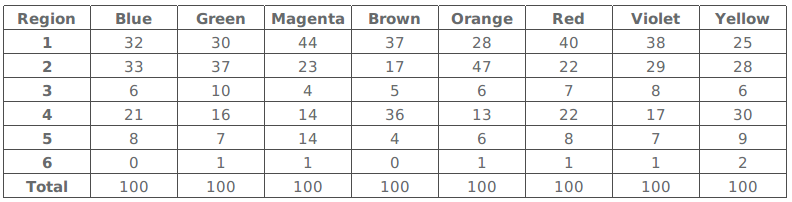
Question 14: In which region is the maximum percentage of blue saris sold?
a) 2
b) 3
c) 1
d) 4
14) Answer (A)
Solution:
From Table 5, we can see that out of all the regions, the maximum number of blue saries were sold in region 2
Question 15: Out of its total sales, which region sold the minimum percentage of green saris?
a) 1
b) 4
c) 6
d) 2
15) Answer (B)
Solution:
Given we have 6 regions where sales are defined in the table number two . Now given that we need to find the region where green saris as a percentage of the total sales is lowest . In order to do that we calculate Green saris sold in a region/ Total sales of a particular region by considering the values from table 2 .
Now for option 1 which is region 1 the value is (164/788)*100 = 20.81 %
For option 2 which is region 4 the value is (85/511)*100 = 16.63 %
For option 1 which is region 6 the value is (3/18)*100 = 16.66 %
For option 1 which is region 2 the value is (200/676)*100 = 29.58 % .
Hence among the given options the percentage of region 4 is lowest which is option 2 .
Question 16: Which region sold the maximum percentage of magenta saris out of the total sales of magenta saris?
a) 3
b) 4
c) 2
d) 1
16) Answer (D)
Solution:
Since table 2 gives us the sales values of saris
Hence, for the magenta sari, Region1 has the maximum number of sales out of total magenta sales.
I.e. 71 out of 161.
Question 17: Which colour is the most popular in region1?
a) Blue
b) Brown
c) Green
d) Violet
17) Answer (B)
Solution:
As the most popular colours will have more sale than any other colour
Since table 2 gives us value of sales, Brown colour in region 1 has maximum no. of sales
Hence, our answer will be Brown.
Question 18: Which region-colour combination accounts for the highest percentage of sales to stock?
a) (1, Brown)
b) (2, Yellow)
c) (4, Brown)
d) (5, Red
18) Answer (C)
Solution:
Sales to stock percentage values are given in table 3
And at region 4, Brown colour, percentage is maximum compared to all.
Hence answer will be C


