
SNAP DI Tables Questions PDF [Most Important]
DI Tables is an important topic in the Quant section of the SNAP Exam. You can also download this Free DI Tables Questions for SNAP PDF (with answers) by Cracku. These questions will help you to practice and solve the DI Tables questions in the SNAP exam. Utilize this PDF practice set, which is one of the best sources for practising.
Download DI Tables Questions for SNAP
Enroll to SNAP 2022 Crash Course
Instructions
The following table presents Purpose-wise Total Balances (Overdues) of Primary Agricultural Credit Societies (PACS) of some select States of India. Answer the following four questions based on this table.

Question 1: In the table above, which state shows the highest variabillity of overdues?
a) Madhya Pradesh
b) Kerala
c) Gujarat
d) Karnataka
1) Answer (B)
Solution:
From the table above we can see that the highest variability in revenue is shown by Kerala.
Question 2: From the data given in the table, which of the following two statements is TRUE:
1) Average annual temperatures for year 2011 are more than average annual temperatures for years 2013.
2) Average annual temperatures for year 2010 are more than average annual temperatures for years 2012.

a) Both statements are true
b) Statement 1 is false but Statement 2 is true
c) Statement 1 is true but Statement 2 is false
d) Both statements are false
2) Answer (D)
Solution:
Statement 1):
Average annual temperature in year 2011 = (12 + 30 + 22 + 30)/4 = 23.5
Average annual temperature in year 2013 = (16 + 32 + 24 + 32)/4 = 26
Average annual temperature in year 2011 > Average annual temperature in year 2013
Statement 1) is False.
Statement 2):
Average annual temperature in year 2010 = (14 + 32 + 24 + 28)/4 = 24.5
Average annual temperature in year 2012 = (16 + 34 + 24 + 30)/4 = 26
Average annual temperature in year 2010 < Average annual temperature in year 2012
Statement 2) is false.
Question 3: The following table gives the percentage distribution of population of five states, P, Q, R, S and T on the basis of poverty line and gender. If the male population above poverty line for state R is 1.9 million, then the total population of state R is?
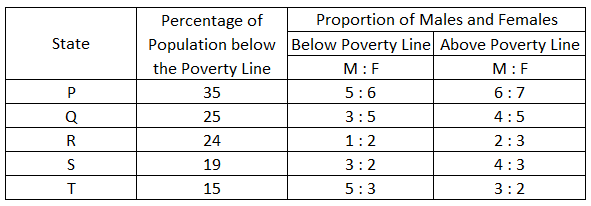
a) 6.25 million
b) 5.35 million
c) 4.5 million
d) 4.85 million
3) Answer (A)
Solution:
Let total population of state R = $100x$ million
% of people below poverty line in state R = $24x$ and above poverty line = $76x$
Males above poverty line = $\frac{2}{5}\times76x=1.9$
=> $x=\frac{0.5}{8}=0.0625$
$\therefore$ Total population of state R = 6.25 million
=> Ans – (A)
Question 4: The following table shows the courier charges (in Rs.) for sending 1 kg parcel from one city to another.

Among the following, the charges will be the least for sending a parcel from:-
a) Ahmedabad to Jaipur
b) Mumbai to Bangalore
c) Jaipur to Bangalore
d) Kolkata to Mumbai
4) Answer (D)
Solution:
By carefully observing the given data and by observing the given options,
The charges will be least for the parcel from Kolkata to Mumbai which is Rs. 7,
Hence option (D) is the answer.
Instructions
Study the following Information carefully and answer the questions given below
Number of students appeared ,passed and granted scholarships over the years

Question 5: Which of the following seems table most possible reason for substantial increase of number appeared in 1999 ?
a) The increase in the Progressive and in line with the trend from 1994
b) Substantial increase in the Number of scholarships in 1998 as compared to other years
c) Proportion of passed to Appeared increasing progressive?
d) General population increase in the later half of 1999
e) Pass number crossing 200 marks
5) Answer (B)
Solution:
In 1998, the number of scholarships granted was increased as compared to other years and this can be the reason for substantial increase of number appeared in 1999.
=> Ans – (B)
Take SNAP mock tests here
Enrol to 10 SNAP Latest Mocks For Just Rs. 499
Instructions
Direction: Study the given graph carefully to answer the questions that follow
Number of days taken by three carpenters to finish making one piece each of four different items of furniture
<img “=”” alt=”” class=”img-responsive” src=”https://cracku.in/media/questionGroup/DI_5_1.jpg “/>
Question 6: If Carpenters X, Y and Z were to make a table together how many days would they take ?
a) 4 days
b) 3 days
c) 1 day
d) 2 days
e) None of these
6) Answer (C)
Solution:
Individually, they take 2, 3 and 6 days respectively to make the table.
So, their combined one day work = 1/2 + 1/3 + 1/6 = 1
So, the three of them can finish making a table in 1 day.
Instructions
Direction: Study the given graph carefully to answer the questions that follow:
Number of days taken by three carpenters to finish making one piece each of four different items of furniture
<img “=”” alt=”” class=”img-responsive” src=”https://cracku.in/media/questionGroup/DI_5.jpg “/>
Question 7: If Carpenters X, Y and Z were to make a table together how many days would they take ?
a) 4 days
b) 3 days
c) 1 day
d) 2 days
e) None of these
7) Answer (C)
Solution:
Individually, they take 2, 3 and 6 days respectively to make the table.
So, their combined one day work = 1/2 + 1/3 + 1/6 = 1
So, the three of them can finish making a table in 1 day.
Question 8: In the table, the production and the sale (in 1000 tonnes) of a certain product of a company over5 years is given.
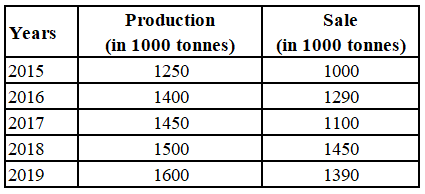
In which year(s) the production increases by more than 10% of that in the previous year?
a) 2018, 2019
b) 2017, 2018
c) 2019
d) 2016
8) Answer (D)
Solution:
Percentage increase in production of 2016 compared to 2015 = $\frac{150}{1250}\times$100 = 12%
Percentage increase in production of 2017 compared to 2016 = $\frac{50}{1400}\times$100 = 3.57%
Percentage increase in production of 2018 compared to 2017 = $\frac{50}{1450}\times$100 = 3.44%
Percentage increase in production of 2019 compared to 2018 = $\frac{100}{1500}\times$100 = 6.67%
$\therefore$ Only in 2016, the production increases by more than 10% of that in the previous year.
Hence, the correct answer is Option D
Question 9: Table shows District-wise data of number of primary school teachers posted in schools of a city.
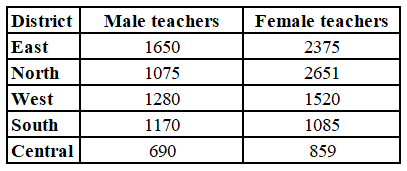
What is the difference between the total number of male teachers in the districts East, North, West taken together and the total number of female teachers in the districts East and South?
a) 735
b) 771
c) 110
d) 545
9) Answer (D)
Solution:
The total number of male teachers in the districts East, North, West taken together = 1650 + 1075 + 1280
= 4005
The total number of female teachers in the districts East and South = 2375 + 1085
= 3460
Required difference = 4005 – 3460
= 545
Hence, the correct answer is Option D
Question 10: Table shows the number of trees planted in 4 cities from 2016 to 2020.
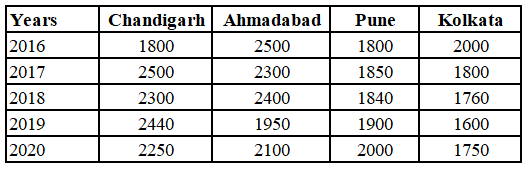
In which city were maximum trees planted in 2016 and 2019 taken together?
a) Chandigarh
b) Ahmedabad
c) Pune
d) Kolkata
10) Answer (B)
Solution:
Trees planted in Chandigarh in 2016 and 2019 together = 1800 + 2440 = 4240
Trees planted in Ahmedabad in 2016 and 2019 together = 2500 + 1950 = 4450
Trees planted in Pune in 2016 and 2019 together = 1800 + 1900 = 3700
Trees planted in Kolkata in 2016 and 2019 together = 2000 + 1600 = 3600
$\therefore$ In Ahmedabad, maximum trees planted in 2016 and 2019 taken together
Hence, the correct answer is Option B


