
RRB JE Data Interpretation Questions PDF
Download Top 20 RRB JE Data Interpretation Questions and Answers PDF. RRB JE Maths questions based on asked questions in previous exam papers very important for the Railway JE exam
Download RRB JE Data Interpretation Questions PDF
Download RRB JE Previous Papers PDF
Instructions

Answer the following using Pie chart and the total chocolates are 350.
Question 1: What is the average number of chocolates received by Ravi,Praful and Srujay ?
a) 80
b) 70
c) 50
d) 60
Question 2: What is the difference between the person receiving highest and lowest number of chocolates ?
a) 105
b) 80
c) 90
d) 70
Instructions

Answer the following using Pie chart and the total cash prize is 21 millions.
Question 3: What is the difference between the averages of cash prize received by Vince,Cena,Kofi combinedly and Orton,Roman,Kofi combinedly ?
a) 0.24 millions
b) 0.36 millions
c) 0.48 millions
d) 0.56 millions
Question 4: What is the average of cash prize won by Vince,Cena and Orton ?
a) 5 millions
b) 4.9 millions
c) 3.8 millions
d) 5.6 millions
Instructions
Answer the following using Pie chart.

Question 5: If the total runs scored by all the players is 500, what is the difference between total runs scored by Kiran,Kohli,Sehwag combinedly and Virat and Rahul combinedly ?
a) 25
b) 50
c) 100
d) 75
Question 6: If the total runs scored by all the players is 500. What is the difference between the runs scored by Kohli and Virat ?
a) 30
b) 50
c) 25
d) 35
18000+ Questions – Free SSC Study Material
Instructions
The number of students appearing for Medical entrance exam from 4 different states over a four year period is shown in the table below
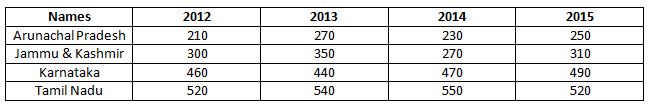
Study the table carefully and answer the questions that follow:
Question 7: If we consider each of the numbers for Tamil Nadu as an observation, what is the “mode” of the observations over the four years?
a) 532
b) 530
c) 527
d) 520
Question 8: What the approximate percentage decrease in the number of students appearing from Arunachal Pradesh and Jammu and Kashmir, combined from 2013 to 2014?
a) 5%
b) 10%
c) 15%
d) 20%
Question 9: Which year has the highest number of students appearing for the exam?
a) 2012
b) 2013
c) 2014
d) 2015
Instructions
The marks of 4 students in Maths over four years is as shown in the diagram below.
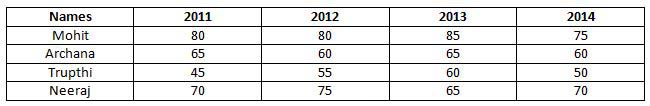
Study the table carefully and answer the questions that follow:
Question 10: What is the standard deviation of the scores in 2011?
a) 15.75
b) 12.75
c) 10.75
d) 25.5
RRB JE Free Mock Test (latest pattern)
Question 11: What is the median score in 2012?
a) 67.5
b) 70
c) 72.5
d) 75
Question 12: Who has the highest range of marks in Maths in these four years?
a) Mohit
b) Archana
c) Trupthi
d) Neeraj
Instructions
The total usage of pesticides and fertilisers in the state of Kerala from 2001 to 2004 is as shown in the diagram below.
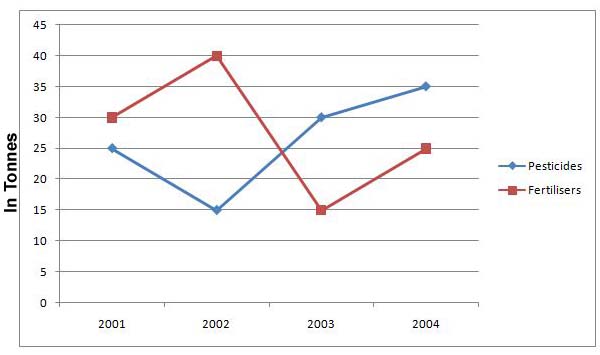
Study the chart carefully and answer the questions that follow:
Question 13: If the cost of pesticides is Rs. 2500 per tonne and cost of fertilisers is Rs. 3000 per tonne, on which of the following did the state of Kerala spend more money on, over all the years combined?
a) Fertilizers
b) Pesticides
c) Same on both
d) Can’t be determined
Question 14: What is the percentage decrease in the total amount of pesticides and fertilizers used between 2001 and 2003?
a) 12%
b) 15%
c) 18%
d) 21%
Question 15: In which year is the ratio of fertilisers to pesticides the lowest?
a) 2001
b) 2002
c) 2003
d) 2004
Daily Free Online Tests for RRB Exams
Instructions
The incomes and expenses of four large IT companies for the year 2014 is shown in the diagram below
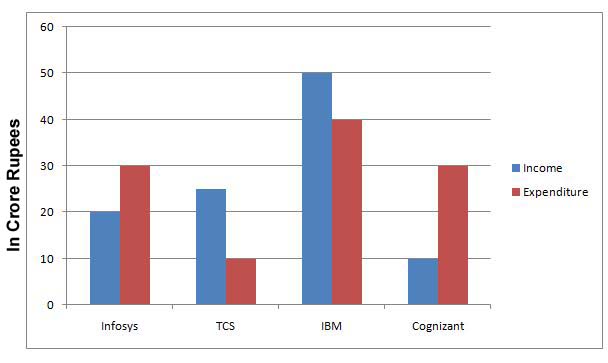
Study the chart carefully and answer the questions that follow.
Question 16: By how much is the average income per company less than the average expenditure per company?
a) 125000
b) 1250000
c) 12500000
d) 125000000
Question 17: How many of the four companies have had a surplus in the year 2014?
a) 0
b) 1
c) 2
d) 3
Question 18: Which company has the highest expenditure to income ratio?
a) Infosys
b) TCS
c) IBM
d) Cognizant
Instructions
In a school, the percentage of students who passes the following subjects in different classes is shown in the table below. The number of students appearing from each class is 40 students. Failing in any one subject requires the candidates to get the signature from their parents. Study the table carefully and answer the questions that follow:
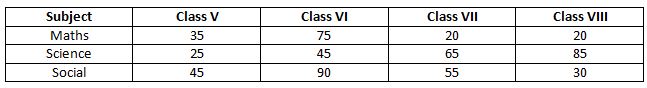
Question 19: If we consider the best case scenarios for each class (ie. the lowest possible number of students requiring to get their parents’ signature from each class), which class has the highest number of students who didn’t have to get their parents’ signature?
a) Class V
b) Class VI
c) Class VII
d) Class VIII
Question 20: How many students passed in Maths from all the four classes taken together?
a) 40
b) 50
c) 60
d) 70
General Science Notes for RRB Exams (PDF)
Answers & Solutions:
1) Answer (B)
Number of chocolates with Ravi=(30/100)*350=105
Number of chocolates with Srujay=(10/100)*350=35
Number of chocolates with Praful=(20/100)*350=70
Average of chocolates receive by these three=(105+35+70)/3
=70
2) Answer (D)
Number of chocolates with Ravi=(30/100)*350=105
Number of chocolates with Srujay=(10/100)*350=35
Difference between them=105-35=70 chocolates
3) Answer (D)
Average of total cash prize received by Vince,Cena,Kofi combinedly=(16+17+29)*21/(300)
Average of total cash prize received by Orton,Roman,Kofi combinedly =(24+14+16)*21/(300)
Difference between the averages=(62-54)*21/(300)
=0.56 millions
4) Answer (B)
Percentage of cash prize won by orton=24%
Percentage of cash prize won by cena=29%
Percentage of cash prize won by vince=17%
Average of these three=(24+29+17)*21/(3*100)
=4.9 millions
5) Answer (B)
Total runs scored by Kiran,Kohli,Sehwag combinedly=(10%+30%+15%)*500=(55/100)*500
=275
Total runs scored by Virat and Rahul=(25%+20%)=(45/100)*500
=225
Difference between them=275-225=50 runs
6) Answer (C)
Percentage of runs scored by Kohli=30%
Percentage of runs scored by Virat=25%
Difference between them is 5% i.e (5/100)*500=25 runs
7) Answer (D)
The values for Tamil Nadu are: 520, 540, 550 and 520.
Since 520 repeats twice (more times than any other value), it is the mode of the observations.
8) Answer (D)
Total students appearing from Arunachal Pradesh and Jammu and Kashmir, combined in 2013 = 270 + 350 = 620
Total students appearing from Arunachal Pradesh and Jammu and Kashmir, combined in 2014 = 230 + 270 = 500
So, percentage decrease = 100* (620 – 500)/620 = 19.35%
9) Answer (B)
The number of students appearing in 2012 = 210 + 300 + 460 + 520 = 1490
The number of students appearing in 2013 = 270 + 350 + 440 + 540 = 1600
The number of students appearing in 2014 = 230 + 270 + 470 + 550 = 1520
The number of students appearing in 2015 = 250 + 310 + 490 + 520 = 1570
So, 2013 has the highest number of students.
10) Answer (B)
The mean of the scores in 2014 = $\frac{80 + 65 + 45 + 70}{4}$ = 65
So, the variance = $\frac{(65 – 80)^2 + (65-65)^2 + (65 – 45)^2 + (65 -70)^2}{4}$ = 650/4 = 162.5
Hence the standard deviation = $\sqrt{162.5}$ = 12.75
11) Answer (A)
The scores for 2012 = 80, 60, 55, 75
Arranging them in the increasing order, we get 55, 60, 75 and 80.
So, the median = $\frac{60 + 75}{2}$ = 67.5
12) Answer (C)
The range of marks (highest – lowest) for Mohit = 85 – 75 = 10
The range of marks (highest – lowest) for Archana= 65 – 60 = 5
The range of marks (highest – lowest) for Trupthi = 60 – 45 = 15
The range of marks (highest – lowest) for Neeraj = 75 – 65 = 10
So, the range is the highest for Trupthi
13) Answer (A)
Total pesticides used = 25 + 15 + 30 + 35 = 105 tons
Total fertilizers used = 30 + 40 + 15 + 25 = 110 tons
Total cost of pesticides = 2500 * 105 = 262,500
Total cost of fertilizers = 3000 * 110 = 330,000
So, the cost of fertilizers is more
14) Answer (C)
Total pesticides and fertilisers used in 2001 = 30 + 25 = 55 tons
Total pesticides and fertilisers used in 2003 = 30 + 15 = 45 tons
So, the percentage change = 100 * (55 – 45) /55 = 18.18%
15) Answer (C)
The ratio of fertilisers to pesticides in 2001 is 30 : 25
The ratio of fertilisers to pesticides in 2002 is 40 : 15
The ratio of fertilisers to pesticides in 2003 is 15 : 30
The ratio of fertilisers to pesticides in 2004 is 25 : 35
So, the lowest ratio is 15:30 (half) in the year 2003.
16) Answer (C)
The average income per company = (20 + 25 + 50 + 10)/4 = 26.25
The average expenditure per company = (30 + 10 + 40 + 30)/4 = 27.50
So, the difference = 27.5 – 26.25 = 1.25 crores
17) Answer (C)
Surplus = Income – Expenditure
The surplus for Infosys = 30 – 20 = 10 crores
The surplus for TCS= 10 – 22 = -12 crores (deficit)
The surplus for IBM = 40 – 50 = – 10 crores (deficit)
The surplus for Cognizant = 30 – 10 = 20 crores
So, 2 companies have surplus and 2 companies have a deficit
18) Answer (D)
The expenditure to income ratio for Infosys is 30 : 20
The expenditure to income ratio for TCS is 10 : 25
The expenditure to income ratio for IBM is 40 : 50
The expenditure to income ratio for Cognizant is 30 : 10
So, Cognizant has the highest expenditure to income ratio.
19) Answer (B)
A class will have less students requiring parents signatures if the same students fail in multiple subjects. So, for example, if we consider class V, the number of failures are 75% in Science. If the failures in social and maths are the same students, the maximum signatures required are for the 75% students. So, 25% didn’t need singatures
Similarly, the best case scenario for Class VI is only 55% students getting signatures.So, 45% didn’t need signatures.
Best case scenario for class VII is 80% students getting signatures. So, 20% didn’t need signatures.
Best case scenario for class VIII is 80% students getting signatures. So, 20% didn’t need signatures.
20) Answer (C)
The total percentage of students who passed in Maths from all the four classes = 35% + 75% + 20% + 20% = 150%
So, the actual number of students that passed = 150% * 40 = 60 students
DOWNLOAD APP FOR RRB FREE MOCKS
We hope this Data Interpretation Questions for RRB JE Exam will be highly useful for your preparation.


