DI Special Charts Questions for CAT
DI Special Charts is one of the important topics in the CAT LRDI section. These sets might look complicated but are not very tough if you practice well. So ensure that you are aware of the Important ways to represent and solve DI Special Charts in LRDI. You can check out these CAT DI Special Charts questions from the CAT Previous year papers. This post will look into some important DI Special Charts for CAT. These are a good source of practice for CAT preparation; If you want to practice these questions, you can download these Important CAT DI Special Charts Questions PDF (with detailed answers) below, which is completely Free.
Download DI Special Charts Questions for CAT
Enroll for CAT 2022 Crash Course
Instructions
Five vendors are being considered for a service. The evaluation committee evaluated each vendor on six aspects – Cost, Customer Service,Features, Quality, Reach, and Reliability. Each of these evaluations are on a scale of 0 (worst) to 100 (perfect). The evaluation scores on these aspects are shown in the radar chart. For example, Vendor 1 obtains a score of 52 on Reliability, Vendor 2 obtains a score of 45 on Features and Vendor 3 obtains a score of 90 on Cost.

Question 1: List of all the vendors who are among the top three vendors on all six aspects is:
a) Vendor 1 and Vendor 3
b) None of the Vendors
c) Vendor 3
d) Vendor 1
1) Answer (C)
Solution:
The data can be tabulated as follows(approximately):

Top 3 on Reliability: Vendor 3, Vendor 5, Vendor 1
Top 3 on Reach: Vendor 1, Vendor 5, Vendor 3
Top 3 on Quality: Vendor 1, Vendor 2, Vendor 3
Top 3 on Features: Vendor 4, Vendor 5, Vendor 3
Top 3 on Customer Services: Vendor 4, Vendor 1, Vendor 3
Top 3 on Cost: Vendor 3, Vendor 2, Vendor 1
Only Vendor 3 ranks among top 3 in all the six parameters.
Question 2: List of all the vendors who are among the top two scorers on the maximum number of aspects is:
a) Vendor 2, Vendor 3 and Vendor 4
b) Vendor 1 and Vendor 5
c) Vendor 2 and Vendor 5
d) Vendor 1 and Vendor 2
2) Answer (B)
Solution:
The data can be tabulated as follows(approximately):

Top 3 on Reliability: Vendor 3, Vendor 5
Top 3 on Reach: Vendor 1, Vendor 5
Top 3 on Quality: Vendor 1, Vendor 2
Top 3 on Features: Vendor 4, Vendor 5
Top 3 on Customer Services: Vendor 4, Vendor 1
Top 3 on Cost: Vendor 3, Vendor 2
Vendor 1: 3 times Vendor 2: Only once Vendor 3: 2 times Vendor 4: 2 times Vendor 5: 3 times
Here 1 and 5 comes 3 times. Hence B is the answer.
Question 3: A vendor’s final score is the average of their scores on all six aspects. Which vendor has the highest final score?
a) Vendor 4
b) Vendor 2
c) Vendor 1
d) Vendor 3
3) Answer (D)
Solution:
The data can be tabulated as follows(approximately):

The average of the vendor will be highest which has highest total score. Hence vendor 3 has the highest average.
Question 4: On which aspect is the median score of the five vendors the least?
a) Customer Service
b) Cost
c) Reliability
d) Quality
4) Answer (A)
Solution:
The data can be tabulated as follows(approximately):

Customer Services: 28,41,50,55,70 (The median is 50)
Cost: 50,71,77,81,90 (The median is 77)
Reliability: 26, 40, 52, 60, 75 (The median is 52)
Quality: 40, 48, 62, 69, 72 (The median is 62)
Features: 40, 45, 56, 75, 90 (The median is 56)
Reach: 46, 58, 63, 70, 80 (The median is 63)
Hence the customer services has the lowest median.
Instructions
A large store has only three departments, Clothing, Produce, and Electronics. The following figure shows the percentages of revenue and cost from the three departments for the years 2016, 2017 and 2018. The dotted lines depict percentage levels. So for example, in 2016, 50% of store’s revenue came from its Electronics department while 40% of its costs were incurred in the Produce department.


In this setup, Profit is computed as (Revenue – Cost) and Percentage Profit as Profit/Cost × 100%.
It is known that
1. The percentage profit for the store in 2016 was 100%.
2. The store’s revenue doubled from 2016 to 2017, and its cost doubled from 2016 to 2018.
3. There was no profit from the Electronics department in 2017.
4. In 2018, the revenue from the Clothing department was the same as the cost incurred in the Produce department.
Question 5: What was the approximate difference in profit percentages of the store in 2017 and 2018?
a) 15.5
b) 25.0
c) 8.3
d) 33.3
5) Answer (C)
Solution:
We can make the following table from the web chart given in the question:

If we consider the total cost in the year
2016 as 100, then according to Statement 1, the total revenue in 2016 must be 200.
The store’s revenue doubled from 2016 to 2017, thus the total revenue in the year 2017 = 400.
We can find the revenue for the individual department in the year 2017, from the table.
There was no profit from the Electronics department in 2017, thus, we can find the total cost in 2017= 300
Considering the statement 4, we can find the total revenue in 2018 and tabulate the following table.
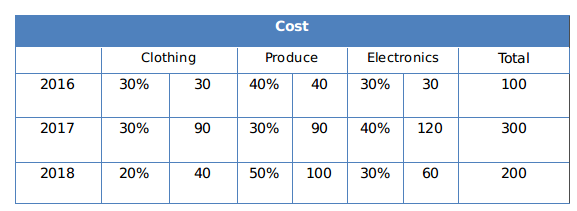
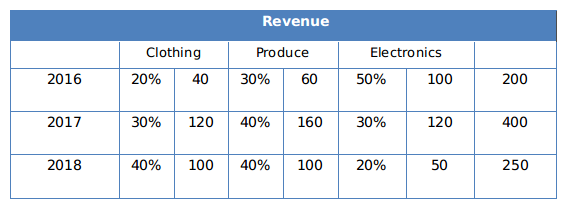
Profit percentage in 2017= (400-300)/300 %= 33.33%
Profit percentage in 2018= (250-200)/200 %= 25%
The approximate difference in profit percentages of the store in 2017 and 2018= (33.33-25)%= 8.33%
Option C.
Checkout: CAT Free Practice Questions and Videos
Question 6: What percentage of the total profits for the store in 2016 was from the Electronics department?
6) Answer: 70
Solution:
We can make the following table from the web chart given in the question:

If we consider the total cost in the year
2016 as 100, then according to Statement 1, the total revenue in 2016 must be 200.
The store’s revenue doubled from 2016 to 2017, thus the total revenue in the year 2017 = 400.
We can find the revenue for the individual department in the year 2017, from the table.
There was no profit from the Electronics department in 2017, thus, we can find the total cost in 2017= 300
Considering the statement 4, we can find the total revenue in 2018 and tabulate the following table.


Profit in 2016 = 200-100= 100
Profit in the electronic department in 2016= 100-30=70
The total profits= for the store in 2016 were from the Electronics department 70%
Question 7: What was the ratio of revenue generated from the Produce department in 2017 to that in 2018?
a) 16 : 9
b) 4 : 3
c) 9 : 16
d) 8 : 5
7) Answer (D)
Solution:
We can make the following table from the web chart given in the question:

If we consider the total cost in the year
2016 as 100, then according to Statement 1, the total revenue in 2016 must be 200.
The store’s revenue doubled from 2016 to 2017, thus the total revenue in the year 2017 = 400.
We can find the revenue for the individual department in the year 2017, from the table.
There was no profit from the Electronics department in 2017, thus, we can find the total cost in 2017= 300
Considering the statement 4, we can find the total revenue in 2018 and tabulate the following table.


The ratio of revenue generated from the Produce department in 2017 to that in 2018 = 160:100= 8:5
Question 8: What was the percentage profit of the store in 2018?
8) Answer: 25
Solution:
We can make the following table from the web chart given in the question:

If we consider the total cost in the year
2016 as 100, then according to Statement 1, the total revenue in 2016 must be 200.
The store’s revenue doubled from 2016 to 2017, thus the total revenue in the year 2017 = 400.
We can find the revenue for the individual department in the year 2017, from the table.
There was no profit from the Electronics department in 2017, thus, we can find the total cost in 2017= 300
Considering the statement 4, we can find the total revenue in 2018 and tabulate the following table.


The percentage profit of the store in 2018= (250-200)/200= 25%
Instructions
To compare the rainfall data, India Meteorological Department (IMD) calculated the Long Period Average (LPA) of rainfall during period June-August for each of the 16 states. The figure given below shows the actual rainfall (measured in mm) during June-August, 2019 and the percentage deviations from LPA of respective states in 2018. Each state along with its actual rainfall is presented in the figure.

Question 9: The LPA of a state for a year is defined as the average rainfall in the preceding 10 years considering the period of June-August. For example, LPA in 2018 is the average rainfall during 2009-2018 and LPA in 2019 is the average rainfall during 2010-2019. It is also observed that the actual rainfall in Gujarat in 2019 is 20% more than the rainfall in 2009. The LPA of Gujarat in 2019 is closest to
a) 475 mm
b) 505 mm
c) 490 mm
d) 525 mm
9) Answer (C)
Solution:
The actual rainfall in Gujarat in 2019 is 20% more than the rainfall in 2009.
So If the actual rainfall in 2009 = x mm
Then the actual rainfall in 2019= 1.2x mm
Actual rainfall in 2019= 600mm
Then, actual rainfall in 2009 = 500mm
As deviation is +25% so average 2009 – 2018 is 600/1.25 = 480
LPA 2019 = (480×10 – 500 + 600 )/10 = 490mm
Answer C
Question 10: What is the average rainfall of all states that have actual rainfall of 600 mm or less in 2019 and have a negative deviation from LPA?
a) 367 mm
b) 500 mm
c) 450 mm
d) 460 mm
10) Answer (D)
Solution:
The states Assam, WB, Jharkhand, Delhi and Manipur satisfy the conditions given in the question.
The actual rainfall of all these states in 2019 are 600,600,400,300,400
Average of these states= 2300/5=460mm
Question 11: If a ‘Low Monsoon State’ is defined as a state with actual rainfall from June-August, 2019 of 750 mm or less, then what is the median ‘deviation from LPA’ (as defined in the Y-axis of the figure) of ‘Low Monsoon States’?
a) -10%
b) 10%
c) -20%
d) -30%
11) Answer (A)
Solution:
All the states which satisfy the condition for ‘ Low monsoon state’ are Gujrat (+25%), Karnataka (+20%), Rajasthan (+15), MP (+10%), Assam (-10%), WB (-30%), Jharkhand (-35%), Delhi (-40%) and Manipur (-60%).
The median of all the deviation is -10% Assam.
Question 12: If a ‘Heavy Monsoon State’ is defined as a state with actual rainfall from June-August, 2019 of 900 mm or more, then approximately what percentage of ‘Heavy Monsoon States’ have a negative deviation from respective LPAs in 2019?
a) 42.86
b) 75.00
c) 57.14
d) 14.29
12) Answer (A)
Solution:
The states which satisfy the condition given in the question:
Maharashtra, Mizoram, Sikkim, Goa, Arunachal, Kerla, Meghalaya…..7 states
The ‘Heavy Monsoon States’ have a negative deviation: Arunachal, Kerla, Meghalaya
= 3/7×100=42.86%
Option A
Instructions
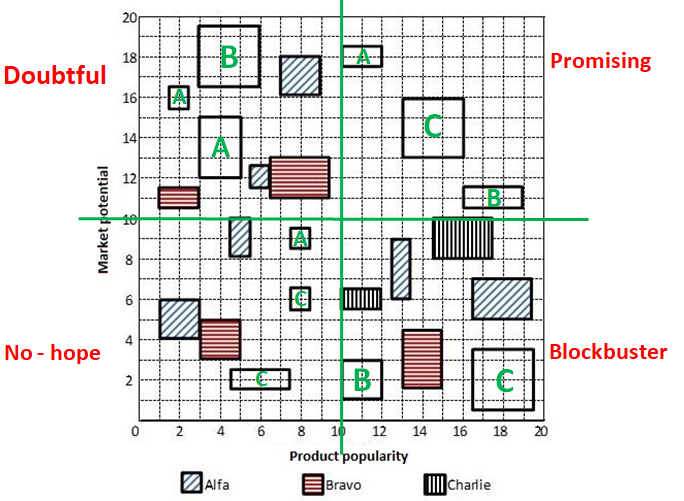
Each of the 23 boxes in the picture below represents a product manufactured by one of the following three companies: Alfa, Bravo and Charlie. The area of a box is proportional to the revenue from the corresponding product, while its centre represents the Product popularity and Market potential scores of the product (out of 20). The shadings of some of the boxes have got erased.

The companies classified their products into four categories based on a combination of scores (out of 20) on the two parameters – Product popularity and Market potential as given below:
 The following facts are known:1. Alfa and Bravo had the same number of products in the Blockbuster category.
2. Charlie had more products than Bravo but fewer products than Alfa in the No-hope category.
3. Each company had an equal number of products in the Promising category.
4. Charlie did not have any product in the Doubtful category, while Alfa had one product more than Bravo in this category
5. Bravo had a higher revenue than Alfa from products in the Doubtful category.
6. Charlie had a higher revenue than Bravo from products in the Blockbuster category.
7. Bravo and Charlie had the same revenue from products in the No-hope category.
8. Alfa and Charlie had the same total revenue considering all products.
Question 13: If the smallest box on the grid is equivalent to revenue of Rs.1 crore, then what approximately was the total revenue of Bravo in Rs. crore?
a) 40
b) 24
c) 34
d) 30
13) Answer (C)
Solution:
Let us divide the given figure in four quadrants (Q1, Q2, Q3, Q4).
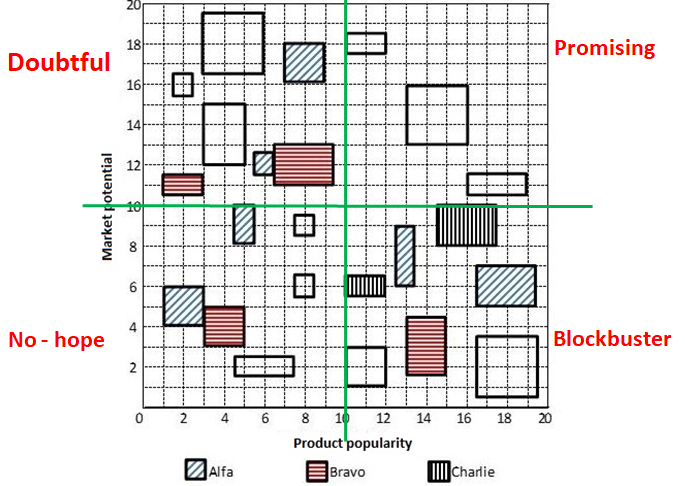
Let us solve this problem by considering only one category at a time.
(A) Blockbuster category: We have two information regarding Blockbuster category.
1. Alfa and Bravo had the same number of products in the Blockbuster category.
There are a total of 7 products in Blockbuster category. Alfa already has two products in blockbuster category. If Alfa has 3 products in blockbuster category then Bravo will also have 3 products in Blockbuster category which is not possible as there are 2 products of Charlie. Hence, we can say that Alfa and Bravo have 2 products each in Blockbuster category whereas Charlie has 3 products in Blockbuster category.
2. It is also given that Charlie had a higher revenue than Bravo from products in the Blockbuster category.
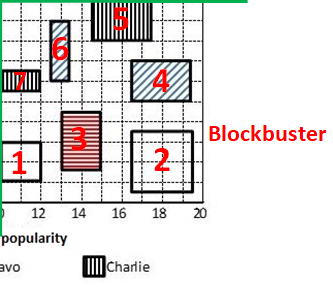
We know that one of the product 1 and 2 is from Charlie and the other is from Bravo.
If product 1 is from Charlie, then we can say that products 1, 7 and 5 are from Charlie. Therefore, revenue generated by products in Charlie category = 2 + 4 + 6 = 12 units. (Assuming area of a square to be 1 unit)
In this case product 2 and product n are from Bravo.Therefore, revenue generated by products in Bravo category = 6 + 9 = 15 units.
We can see that products from Charlie have a higher revenue than Bravo. Hence, this case in not possible.
Therefore, we can say that Product 1 is from Bravo and Product 2 is from Charlie. We have determined each product’s company name in Blockbuster category.
(B) No-hope category: We have two information regarding No-hope category.
(1) Charlie had more products than Bravo but fewer products than Alfa in the No-hope category. Bravo and Charlie had the same revenue from products in the No-hope category.There are a total of 6 products in no-hope category.
Therefore, we can say that Alfa, Charlie and Bravo have 3, 2 and 1 products in No-hope category in that order.
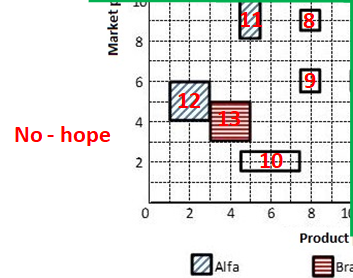
Bravo and Charlie had the same revenue from products in the No-hope category.
Revenue generated for Bravo in the No-hope category = 4 units. We need same revenue for Charlie which ha s 2 products in this category. Hence, we can say that Product 10 and one of product 8 and 9 is from Charlie and other is from Alfa. Let’s assume that product 8 is from Charlie and product 9 is from Alfa.
(C) Doubtful category: We have two information regarding Doubtful category.
(1). Charlie did not have any product in the Doubtful category, while Alfa had one product more than Bravo in this category .
(2). Bravo had a higher revenue than Alfa from products in the Doubtful category.
We can see that there are a total of 7 products in this category. Hence, we can say that 4 products are from Alfa and 3 products are from Bravo.
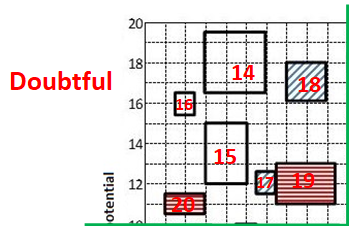
We can see that one of product 14, 15 and 16 is from Bravo company and others are from Alfa company. Bravo will have higher revenue than Alfa only when product no. 14 is from Bravo and others (15 and 16) are from Alfa category.
In this case total revenue by Bravo = Product 14 + Product 19 + Product 20 = 9 + 6 + 2 = 17
Similarly, total revenue by Charlie = Product 15 + Product 16 + Product 17 + Product 18 = 6 + 1 + 1 + 4 = 12
(D) Promising category: We have only 1 direct information regarding Promising category.
1. Each company had an equal number of products in the Promising category.
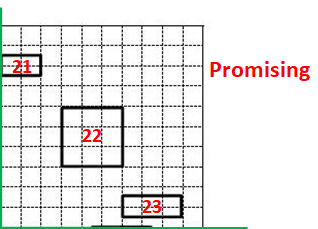
There are a total of 3 products in promising category with different revenue. Therefore, we can say that each company had 1 product in promising category. We are given that Alfa and Charlie had the same total revenue considering all products. We can calculate the revenue generated by Alfa and Charlie from the products in categories.
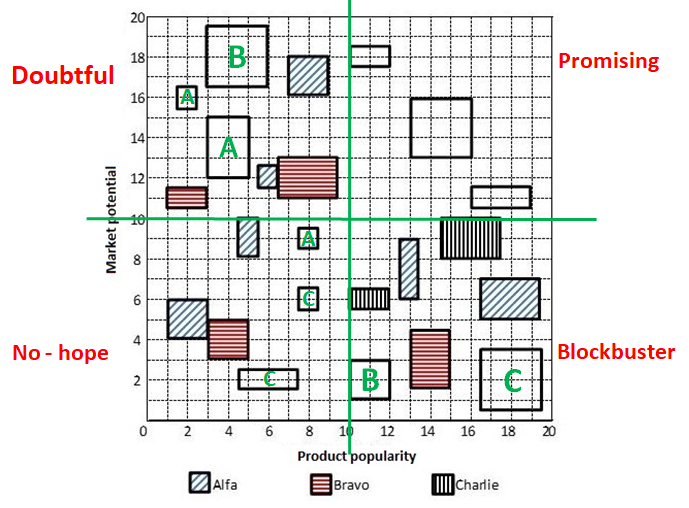
Revenue generated by Charlie from all categories except Promising = From Blockbuster + From No-hope + From Doubtful
$\Rightarrow$ (9+6+2) + (3+1) + (0) = 21 units
Revenue generated by Alfa from all categories except Promising = From Blockbuster + From No-hope + From Doubtful
$\Rightarrow$ (6+3) + (4+2+1) + (1+6+4+1) = 28 units
We can see the difference between revenue generated by Charlie and Alfa from remaining categories is 7 units. Hence, we can say that Charlie’s product’s revenue should be 7 units more than Alfa’s product’s revenue in Promising category. That is possible only in one case where product 22 is from Charlie and product 21 is form Alfa. Consequently, we can say that product 23 is from Bravo. Now we have identified each product’s company name we can answer all the questions.
Total revenue generated by Bravo products alone = From Blockbuster + From No-hope + From Doubtful + From Promising
$\Rightarrow$ (6+4) + (4) + (9+6+2) + (3) = 34 units
One box is equivalent to Rs. 1 crore therefore, we can say that total revenue generated by Bravo = Rs. 34 crores. Hence, option C is the correct answer.
Question 14: Which of the following statements is NOT correct?
a) Alfa’s revenue from Blockbuster products was the same as Charlie’s revenue from Promising products
b) Bravo’s revenue from Blockbuster products was greater than Alfa’s revenue from Doubtful products
c) Bravo and Charlie had the same revenues from No-hope products
d) The total revenue from No-hope products was less than the total revenue from Doubtful products
14) Answer (B)
Solution:
Let us divide the given figure in four quadrants (Q1, Q2, Q3, Q4).

Let us solve this problem by considering only one category at a time.
(A) Blockbuster category: We have two information regarding Blockbuster category.
1. Alfa and Bravo had the same number of products in the Blockbuster category.
There are a total of 7 products in Blockbuster category. Alfa already has two products in blockbuster category. If Alfa has 3 products in blockbuster category then Bravo will also have 3 products in Blockbuster category which is not possible as there are 2 products of Charlie. Hence, we can say that Alfa and Bravo have 2 products each in Blockbuster category whereas Charlie has 3 products in Blockbuster category.
2. It is also given that Charlie had a higher revenue than Bravo from products in the Blockbuster category.

We know that one of the product 1 and 2 is from Charlie and the other is from Bravo.
If product 1 is from Charlie, then we can say that products 1, 7 and 5 are from Charlie. Therefore, revenue generated by products in Charlie category = 2 + 4 + 6 = 12 units. (Assuming area of a square to be 1 unit)
In this case product 2 and product n are from Bravo.Therefore, revenue generated by products in Bravo category = 6 + 9 = 15 units.
We can see that products from Charlie have a higher revenue than Bravo. Hence, this case in not possible.
Therefore, we can say that Product 1 is from Bravo and Product 2 is from Charlie. We have determined each product’s company name in Blockbuster category.
(B) No-hope category: We have two information regarding No-hope category.
(1) Charlie had more products than Bravo but fewer products than Alfa in the No-hope category. Bravo and Charlie had the same revenue from products in the No-hope category.There are a total of 6 products in no-hope category.
Therefore, we can say that Alfa, Charlie and Bravo have 3, 2 and 1 products in No-hope category in that order.

Bravo and Charlie had the same revenue from products in the No-hope category.
Revenue generated for Bravo in the No-hope category = 4 units. We need same revenue for Charlie which ha s 2 products in this category. Hence, we can say that Product 10 and one of product 8 and 9 is from Charlie and other is from Alfa. Let’s assume that product 8 is from Charlie and product 9 is from Alfa.
(C) Doubtful category: We have two information regarding Doubtful category.
(1). Charlie did not have any product in the Doubtful category, while Alfa had one product more than Bravo in this category .
(2). Bravo had a higher revenue than Alfa from products in the Doubtful category.
We can see that there are a total of 7 products in this category. Hence, we can say that 4 products are from Alfa and 3 products are from Bravo.

We can see that one of product 14, 15 and 16 is from Bravo company and others are from Alfa company. Bravo will have higher revenue than Alfa only when product no. 14 is from Bravo and others (15 and 16) are from Alfa category.
In this case total revenue by Bravo = Product 14 + Product 19 + Product 20 = 9 + 6 + 2 = 17
Similarly, total revenue by Charlie = Product 15 + Product 16 + Product 17 + Product 18 = 6 + 1 + 1 + 4 = 12
(D) Promising category: We have only 1 direct information regarding Promising category.
1. Each company had an equal number of products in the Promising category.

There are a total of 3 products in promising category with different revenue. Therefore, we can say that each company had 1 product in promising category. We are given that Alfa and Charlie had the same total revenue considering all products. We can calculate the revenue generated by Alfa and Charlie from the products in categories.

Revenue generated by Charlie from all categories except Promising = From Blockbuster + From No-hope + From Doubtful
$\Rightarrow$ (9+6+2) + (3+1) + (0) = 21 units
Revenue generated by Alfa from all categories except Promising = From Blockbuster + From No-hope + From Doubtful
$\Rightarrow$ (6+3) + (4+2+1) + (1+6+4+1) = 28 units
We can see the difference between revenue generated by Charlie and Alfa from remaining categories is 7 units. Hence, we can say that Charlie’s product’s revenue should be 7 units more than Alfa’s product’s revenue in Promising category. That is possible only in one case where product 22 is from Charlie and product 21 is form Alfa. Consequently, we can say that product 23 is from Bravo. Now we have identified each product’s company name we can answer all the questions.

Let us check all options.
Option (A): Alfa’s revenue from Blockbuster products was the same as Charlie’s revenue from Promising products
Alfa’s revenue from Blockbuster products = 6 + 3 = 9 units.
Charlie’s revenue from Promising products = 9 units. Hence, this statement is true.
Option (B): Bravo’s revenue from Blockbuster products was greater than Alfa’s revenue from Doubtful products.
Bravo’s revenue from Blockbuster products = 6 + 4 = 10 units.
Alfa’s revenue from Doubtful products = 6 + 4 +1 + 1 = 12 units. Hence, this statement is false.
Option (C): Bravo and Charlie had the same revenues from No-hope products.
Bravo’s revenue from No-hope products = 4 units.
Charlie’s revenue from No-hope products = 3 + 1 = 4 units. Hence, this statement is true.
Option (D): The total revenue from No-hope products was less than the total revenue from Doubtful products
Revenue generated by the products in Doubtful category = 1 + 9 + 4 + 6 + 2 + 1 + 6 = 29 units.
Revenue generated by the products in No-hope category = 4 + 4 + 3 + 2 + 1 + 1 = 15 units. Hence, this statement is true.
We can see that statement mentioned in option B is false. Therefore, option B is the correct answer.
Question 15: Which of the following is the correct sequence of numbers of products Bravo had in No-hope, Doubtful, Promising and Blockbuster categories respectively?
a) 1,3,1,2
b) 1,3,1,3
c) 3,3,1,2
d) 2,3,1,2
15) Answer (A)
Solution:
Let us divide the given figure in four quadrants (Q1, Q2, Q3, Q4).

Let us solve this problem by considering only one category at a time.
(A) Blockbuster category: We have two information regarding Blockbuster category.
1. Alfa and Bravo had the same number of products in the Blockbuster category.
There are a total of 7 products in Blockbuster category. Alfa already has two products in blockbuster category. If Alfa has 3 products in blockbuster category then Bravo will also have 3 products in Blockbuster category which is not possible as there are 2 products of Charlie. Hence, we can say that Alfa and Bravo have 2 products each in Blockbuster category whereas Charlie has 3 products in Blockbuster category.
2. It is also given that Charlie had a higher revenue than Bravo from products in the Blockbuster category.

We know that one of the product 1 and 2 is from Charlie and the other is from Bravo.
If product 1 is from Charlie, then we can say that products 1, 7 and 5 are from Charlie. Therefore, revenue generated by products in Charlie category = 2 + 4 + 6 = 12 units. (Assuming area of a square to be 1 unit)
In this case product 2 and product n are from Bravo.Therefore, revenue generated by products in Bravo category = 6 + 9 = 15 units.
We can see that products from Charlie have a higher revenue than Bravo. Hence, this case in not possible.
Therefore, we can say that Product 1 is from Bravo and Product 2 is from Charlie. We have determined each product’s company name in Blockbuster category.
(B) No-hope category: We have two information regarding No-hope category.
(1) Charlie had more products than Bravo but fewer products than Alfa in the No-hope category. Bravo and Charlie had the same revenue from products in the No-hope category.There are a total of 6 products in no-hope category.
Therefore, we can say that Alfa, Charlie and Bravo have 3, 2 and 1 products in No-hope category in that order.

Bravo and Charlie had the same revenue from products in the No-hope category.
Revenue generated for Bravo in the No-hope category = 4 units. We need same revenue for Charlie which ha s 2 products in this category. Hence, we can say that Product 10 and one of product 8 and 9 is from Charlie and other is from Alfa. Let’s assume that product 8 is from Charlie and product 9 is from Alfa.
(C) Doubtful category: We have two information regarding Doubtful category.
(1). Charlie did not have any product in the Doubtful category, while Alfa had one product more than Bravo in this category .
(2). Bravo had a higher revenue than Alfa from products in the Doubtful category.
We can see that there are a total of 7 products in this category. Hence, we can say that 4 products are from Alfa and 3 products are from Bravo.

We can see that one of product 14, 15 and 16 is from Bravo company and others are from Alfa company. Bravo will have higher revenue than Alfa only when product no. 14 is from Bravo and others (15 and 16) are from Alfa category.
In this case total revenue by Bravo = Product 14 + Product 19 + Product 20 = 9 + 6 + 2 = 17
Similarly, total revenue by Charlie = Product 15 + Product 16 + Product 17 + Product 18 = 6 + 1 + 1 + 4 = 12
(D) Promising category: We have only 1 direct information regarding Promising category.
1. Each company had an equal number of products in the Promising category.

There are a total of 3 products in promising category with different revenue. Therefore, we can say that each company had 1 product in promising category. We are given that Alfa and Charlie had the same total revenue considering all products. We can calculate the revenue generated by Alfa and Charlie from the products in categories.

Revenue generated by Charlie from all categories except Promising = From Blockbuster + From No-hope + From Doubtful
$\Rightarrow$ (9+6+2) + (3+1) + (0) = 21 units
Revenue generated by Alfa from all categories except Promising = From Blockbuster + From No-hope + From Doubtful
$\Rightarrow$ (6+3) + (4+2+1) + (1+6+4+1) = 28 units
We can see the difference between revenue generated by Charlie and Alfa from remaining categories is 7 units. Hence, we can say that Charlie’s product’s revenue should be 7 units more than Alfa’s product’s revenue in Promising category. That is possible only in one case where product 22 is from Charlie and product 21 is form Alfa. Consequently, we can say that product 23 is from Bravo. Now we have identified each product’s company name we can answer all the questions.

Bravo had in No-hope, Doubtful, Promising and Blockbuster categories respectively = 1, 3, 1, 2. Hence, option A is the correct answer.
Question 16: Considering all companies’ products, which product category had the highest revenue?
a) No-hope
b) Blockbuster
c) Doubtful
d) Promising
16) Answer (B)
Solution:
Let us divide the given figure in four quadrants (Q1, Q2, Q3, Q4).

Let us solve this problem by considering only one category at a time.
(A) Blockbuster category: We have two information regarding Blockbuster category.
1. Alfa and Bravo had the same number of products in the Blockbuster category.
There are a total of 7 products in Blockbuster category. Alfa already has two products in blockbuster category. If Alfa has 3 products in blockbuster category then Bravo will also have 3 products in Blockbuster category which is not possible as there are 2 products of Charlie. Hence, we can say that Alfa and Bravo have 2 products each in Blockbuster category whereas Charlie has 3 products in Blockbuster category.
2. It is also given that Charlie had a higher revenue than Bravo from products in the Blockbuster category.

We know that one of the product 1 and 2 is from Charlie and the other is from Bravo.
If product 1 is from Charlie, then we can say that products 1, 7 and 5 are from Charlie. Therefore, revenue generated by products in Charlie category = 2 + 4 + 6 = 12 units. (Assuming area of a square to be 1 unit)
In this case product 2 and product n are from Bravo.Therefore, revenue generated by products in Bravo category = 6 + 9 = 15 units.
We can see that products from Charlie have a higher revenue than Bravo. Hence, this case in not possible.
Therefore, we can say that Product 1 is from Bravo and Product 2 is from Charlie. We have determined each product’s company name in Blockbuster category.
(B) No-hope category: We have two information regarding No-hope category.
(1) Charlie had more products than Bravo but fewer products than Alfa in the No-hope category. Bravo and Charlie had the same revenue from products in the No-hope category.There are a total of 6 products in no-hope category.
Therefore, we can say that Alfa, Charlie and Bravo have 3, 2 and 1 products in No-hope category in that order.

Bravo and Charlie had the same revenue from products in the No-hope category.
Revenue generated for Bravo in the No-hope category = 4 units. We need same revenue for Charlie which ha s 2 products in this category. Hence, we can say that Product 10 and one of product 8 and 9 is from Charlie and other is from Alfa. Let’s assume that product 8 is from Charlie and product 9 is from Alfa.
(C) Doubtful category: We have two information regarding Doubtful category.
(1). Charlie did not have any product in the Doubtful category, while Alfa had one product more than Bravo in this category .
(2). Bravo had a higher revenue than Alfa from products in the Doubtful category.
We can see that there are a total of 7 products in this category. Hence, we can say that 4 products are from Alfa and 3 products are from Bravo.

We can see that one of product 14, 15 and 16 is from Bravo company and others are from Alfa company. Bravo will have higher revenue than Alfa only when product no. 14 is from Bravo and others (15 and 16) are from Alfa category.
In this case total revenue by Bravo = Product 14 + Product 19 + Product 20 = 9 + 6 + 2 = 17
Similarly, total revenue by Charlie = Product 15 + Product 16 + Product 17 + Product 18 = 6 + 1 + 1 + 4 = 12
(D) Promising category: We have only 1 direct information regarding Promising category.
1. Each company had an equal number of products in the Promising category.

There are a total of 3 products in promising category with different revenue. Therefore, we can say that each company had 1 product in promising category. We are given that Alfa and Charlie had the same total revenue considering all products. We can calculate the revenue generated by Alfa and Charlie from the products in categories.

Revenue generated by Charlie from all categories except Promising = From Blockbuster + From No-hope + From Doubtful
$\Rightarrow$ (9+6+2) + (3+1) + (0) = 21 units
Revenue generated by Alfa from all categories except Promising = From Blockbuster + From No-hope + From Doubtful
$\Rightarrow$ (6+3) + (4+2+1) + (1+6+4+1) = 28 units
We can see the difference between revenue generated by Charlie and Alfa from remaining categories is 7 units. Hence, we can say that Charlie’s product’s revenue should be 7 units more than Alfa’s product’s revenue in Promising category. That is possible only in one case where product 22 is from Charlie and product 21 is form Alfa. Consequently, we can say that product 23 is from Bravo. Now we have identified each product’s company name we can answer all the questions.

Revenue generated by the products in Promising category = 2 + 9 + 3 = 14 units.
Revenue generated by the products in Doubtful category = 1 + 9 + 4 + 6 + 2 + 1 + 6 = 29 units.
Revenue generated by the products in No-hope category = 4 + 4 + 3 + 2 + 1 + 1 = 15 units.
Revenue generated by the products in Blockbuster category = 6 + 3 + 6 + 2 + 4 + 6 + 9 = 36 units.
We can see that the revenue generated is the highest for Blockbuster category. Hence, option B is the correct answer.
Instructions
Analyze the railway train chart below:

Question 17: If you have to travel from AAA and reach HHH at around 9:00 AM, and then further travel to NNN at around 6:00 PM, which is the best combination of trains for you?
a) 1111 and 8800
b) 1111 and 9900
c) 8888 and 7777
d) 8888 and 8800
e) 8888 and 9900
17) Answer (D)
Solution:
Only 3 trains – 4444, 5555, and 8888 reach HHH before 9 AM. Among these 3 trains, 8888 reaches just before 9 AM and hence, it is the best train to reach HHH from AAA. 8800 reaches HHH at 6 PM exactly. Therefore, it is the best train to travel from HHH to NNN. Therefore, option D is the right answer.
Question 18: Which is the fastest train between AAA and NNN?
a) 8800
b) 8888
c) 6666
d) 4444
e) 3333
18) Answer (A)
Solution:
In the graph, the line with the steepest slope should be preferred to travel in the shortest possible time.
The line representing 8800 completes within 2 hour slot and has the steepest slope among the given options. Therefore, option A is the right answer.
Question 19: Which is the fastest train between HHH and NNN?
a) 1111
b) 2222
c) 4444
d) 7777
e) 9999
19) Answer (D)
Solution:
Except 7777, all other trains take at least 2 hours to cover the distance between the stations HHH and NNN. Therefore, option D is the right answer.
Instructions
The grid below captures relationships among seven personality dimensions: “extraversion”, “true_arousal_plac”, “true_arousal_caff”, “arousal_plac”, “arousal_caff”, “performance_plac”, and “performance caff”. The diagonal represents histograms of the seven dimensions. Left of the diagonal represents scatterplots between the dimensions while the right of the diagonal represents quantitative relationships between the dimensions. The lines in the scatterplots are closest approximation of the points. The value of the relationships to the right of the diagonal can vary from -1 to +1, with -1 being the extreme linear negative relation and +1 extreme linear positive relation. (Axes of the graph are conventionally drawn).

Question 20: Which of the following options is correct?
a) 0.93 on the right side of the diagonal corresponds to the third scatterplot in the fourth row.
b) 0.94 on the right side of the diagonal corresponds to the second scatterplot in the fourth row.
c) 0.38 is the relationship between “extraversion” and “true_arousal_plac”.
d) “arousal_catr” and “performance_caff” arc positively related.
e) The line that captures relationship between “arousal_caff” and “arousal_plac” can be denoted by equation: y-= a-bx, where b>0.
20) Answer (B)
Solution:
0.94 is quantitative relationship between true_arousal_plac and arousal_plac. Scatterplot that shows this relationship is the second one in fourth row on the left side of the diagonal.
Question 21: In which of the following scatterplots, the value of one dimension can be used to predict the value of another, as accurately as possible?
a) “extraversion” and “true_ arousal_caff’
b) “true_arousal_plac” and “arousal_plac”
c) “true_arousal_plac” and “performance_plac”
d) “true_arousal_plac” and “performancc_caff”
e) All the above are irrelevant relations.
21) Answer (C)
Solution:
Scatterplot between “true_arousal_plac” and “performance_plac” is least scattered, which shows strong relationship between two dimensions.
Question 22: Which of the scatterplots shows the weakest relationship?
a) Between “extraversion” and “performance_caff”.
b) Between “true_arousal_plac” and “arousal_plac”.
c) Between “true_arousal_plac” and “performance_plac”.
d) Between “true_arousal_caff” and “performance_caff”.
e) Between “arousal_caff” and “performance_caff”.
22) Answer (A)
Solution:
+1 being the extreme linear positive relation and -1 being the extreme linear negative relation. Relationship is weakest when the value is closest to 0.
Among the given options, A is the weakest.
OR
Among the given plots, scattered plot between “extraversion” and “performance_caff” is the most scattered. Therefore weakest relationship.
Question 23: Which of the following is true?
a) “Extraversion” has two modes.
b) Median for “arousal_plac” is definitely the same as its average.
c) Median for “arousal_caff” is definitely higher than its average.
d) Median for “performance_plac” is definitely lower than its average.
e) Median for “performance_caff” is definitely lower than its average.
23) Answer (A)
Solution:
Histogram is a graph which depicts the frequency of occurence of values in different ranges.
For example, lets consider 50 students attended an exam. The distribution of number of students in different score ranges is depicted by the following histogram

In this question we have histograms for different personality dimensions.
However the x and y co-ordinates are not given.
Since the y co-ordinate gives us frequency/number of occurences of a certain value, we can use a histogram to calculate mean median and mode even without details of x-y co ordinate axes
Option A : “Extraversion” has 2 modes.
We can calculate mean of a histogram table by averaging all the values
We can calculate the median of a histogram table by arranging the histograms in ascending order and the bar/value which is in the middle will get the median.
Median for “arousal_plac” = -3
Avergae for “arousal_plac” = (-4-3-2+1+0-3-4)/7 = -15/7 = -2.143
Median for “arousal_caff” = 0
Average for “arousal_caff” = (-1.5-1.5+2+1.75+1.5+1.75+1+0-0.5-2-2)/11 = 0.0454
Median for “performance_plac” = 0.075
Average for “performance_plac” = (0.025+0.075+0.05+0.1+0.2)/5 = 0.09
Median for “performance_caff” = 0.075
Average for “performance_caff” = (0.05+0.25+0.09+0.075+0.08+0.075+0.085+0.1+0.1+0.15+0.18)/11 = 0.1122




![CAT Averages Questions PDF [Important Questions] CAT AVERAGES Questions PDF](https://cracku.in/blog/wp-content/uploads/2022/07/CAT-AVERAGES-Questions-PDF-218x150.png)
