SSC GD Quant Test 9
Instructions
In the following questions, the graph shows the demand and production of different companies. Study the graph and answer the questions.
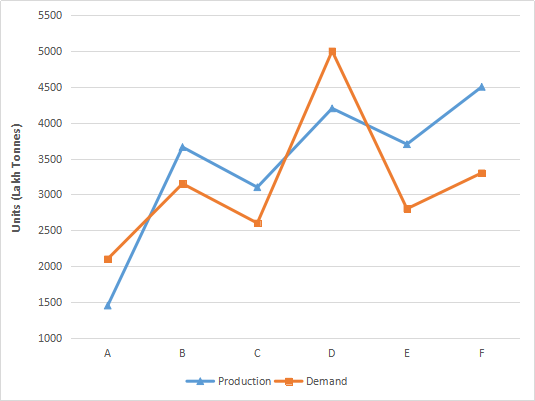
Q 1
The demand of company E is approximately what percentage of the production of company F ?
Q 2
What is the difference between the average demand and the average production of the companies (in lakh tonnes)? [Approximately]
Q 3
The production of company A is approximately what percent of the demand of company C ?
Q 4
What is the ratio of the companies having more demand than production to those having more production than demand ?
Instructions
For the following questions answer them individually
Q 5
The three equal circles touch each other externally. If the centres of these circles be A, B, C then ABC is
Leaderboard
| # | Name | Overall Score |
|---|---|---|
| 1 | Shubham Kumar | 5 |
| 2 | Manpreet Singh | 5 |
| 3 | Sandeep | 5 |
| 4 | RANJITA MAURYA | 5 |
| 5 | vijay Rahangdale | 4 |
| 6 | Prachi | 4 |
| 7 | Maneshwar Singh | 3 |
| 8 | Balwant Singh Chouhan | 3 |
| 9 | AKSHAY SHARMA | 3 |
| 10 | Kamal Prasad | 3 |