SSC GD Quant Test 14
Instructions
Study the following Histogram and answer the following questions.
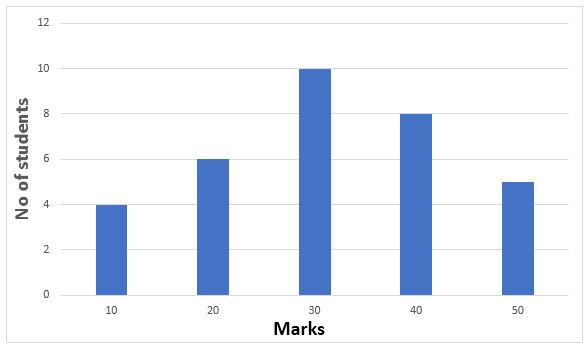
Q 1
The total number of students involved in the data is
Q 2
The maximum number of students got the marks in the interval of
Q 3
The least number of students got the marks in the interval
Q 4
The ratio of the students obtaining marks in the first and last interval is
Instructions
For the following questions answer them individually
Q 5
In the following number series a wrong number is given. Find out that number.
8, 18, 40, 86, 178, 370, 752
Leaderboard
| # | Name | Overall Score |
|---|---|---|
| 1 | Stephen | 5 |
| 2 | Madhu Sharma | 5 |
| 3 | Bhupendra Dhunde | 5 |
| 4 | Sabeela Noufal | 5 |
| 5 | ankur | 5 |
| 6 | TARAGALLA D D PHANEESWAR BABU | 5 |
| 7 | AKSHAY SHARMA | 5 |
| 8 | Karan Mehra | 5 |
| 9 | Vishal Vaibhav | 5 |
| 10 | Mani Mozhi | 5 |