SSC CGL Quant Test 3
Instructions
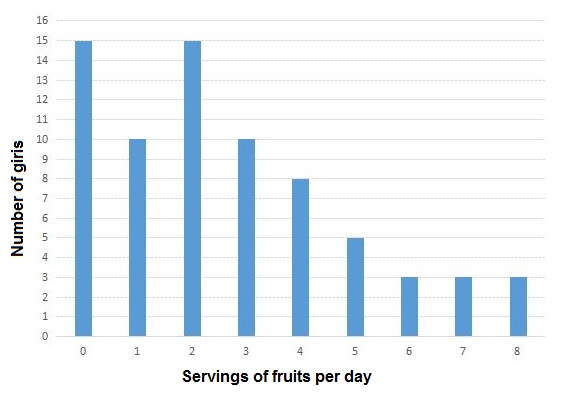
The distribution of fruit consumption in a sample of 72 seventeen – year – old girls is given in the graph below. Study the graph and answer the questions.
Distribution of fruit consumption
Q 1
How many of these girls ate fewer than two servings per day ?
Q 2
What percent of these girls ate six or more servings per day ?
Q 3
How many of these girls ate more than two servings but less than six servings per day ?
Instructions
For the following questions answer them individually
Q 4
The value of $$sin^{2} 65^{\circ} + sin^{2} 25^{\circ} + cos^{2} 35^{\circ} + cos^{2} 55^{\circ}$$ is
Q 5
If a = 4011 and b = 3989 then value of ab = ?
Leaderboard
| # | Name | Overall Score |
|---|---|---|
| 1 | Abhimanyu | 5 |
| 2 | suvam sinha | 5 |
| 3 | Dev Charan | 5 |
| 4 | Vamshi Reddy | 5 |
| 5 | Rakesh Goud | 5 |
| 6 | mohit garg | 5 |
| 7 | Vishal Sandilya | 5 |
| 8 | Shubham Kumar | 5 |
| 9 | Rohit | 5 |
| 10 | NIVITA GUPTA | 5 |