SSC CGL Mathematics Test 59
The line chart given below shows the ratio of production to sales of two bike-manufacturing firms over the period of 6 years.
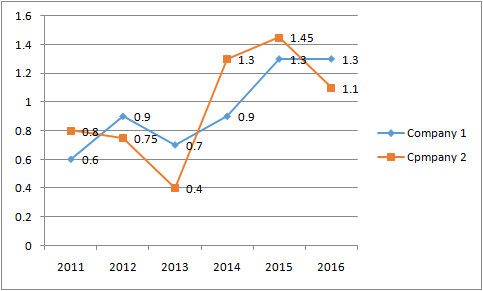
Assume if in any year sales is more than production then both the companies has sufficient stock to meet such instances.
If the sales of company 1 in year 2015 was 50000 units, then what was its production (in units) in year 2015?
The production of company 2 in year 2012 is 30000. If sales of company 2 in year 2012 and 2013 is same, then what was its production (in units) in year 2013?
The production of company 1 in year 2014 is 18000 and sales of company 2 in year 2012 is 15000. What is the ratio of difference in sales and production of company 1 in year 2014 and company 2 in year 2012 ?
Company 1 sold 20000 bikes each year from 2011 to 2016 and company 2 sold 10000 bikes each year from 2011 to 2016. What is the difference (in units) in average yearly production of company 1 and 2?
For the following questions answer them individually
In a cyclic quadrilateral ABCD ∠BCD=120° and AB passes through the centre of the circle. Then ∠ABD = ?
Leaderboard
| # | Name | Overall Score |
|---|---|---|
| 1 | Payal Soni | 5 |
| 2 | Abhinaba Dey | 5 |
| 3 | Jitendra Pathariya | 5 |
| 4 | Pradeep Jha | 5 |
| 5 | dhanjee patel | 5 |
| 6 | vinod | 5 |
| 7 | Mayank Bhargava | 5 |
| 8 | pankaj | 5 |
| 9 | Jaypee Singh | 4 |
| 10 | Chandra Sekhar | 4 |